213
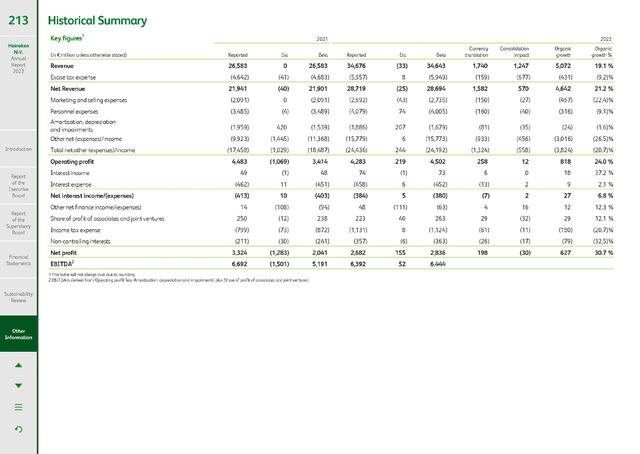
Historical Summary
Key figures1
2021
2022
(in million unless otherwise stated)
Reported
Eia
Beia
Reported
Eia
Beia
(33)
19.1
Revenue
26,583
0
26,583
34,676
34,643
1,740
1,247
5,072
(4,642)
(41)
(4,683)
(5,957)
(5,949)
(159)
(677)
(431)
(9.2)%
Excise tax expense
8
(40)
(25)
21.2
Net Revenue
21,941
21,901
28,719
28,694
1,582
570
4,642
Marketing and selling expenses
(2,091)
(2,091)
(2,692)
(43)
(2,735)
(150)
(27)
(467)
(22.4)%
0
(3,485)
(4)
(3,489)
(4,079)
(4,005)
(160)
(40)
(316)
(9.1)%
74
(1,959)
(1,539)
(1,886)
(1,679)
(81)
(35)
(24)
(1.6)%
420
207
(9,923)
(1,445)
(11,368)
(15,779)
(15,773)
(933)
(456)
(3,016)
(26.5)%
6
Introduction
Total net other (expenses)/income
(17,458)
(1,029)
(18,487)
(24,436)
(24,192)
(1,324)
(558)
(3,824)
(20.7)%
244
Operating profit
(1,069)
24.0
4,483
3,414
4,283
219
4,502
258
12
818
(1)
(1)
Interest income
49
48
74
73
6
0
18
37.2
(462)
(451)
(458)
(452)
(13)
Interest expense
11
6
2
9
2.1
Net interest income/(expenses)
(413)
(403)
(384)
(380)
(7)
6.8
10
5
2
27
Other net finance income/(expenses)
(108)
(94)
(111)
(63)
14
48
4
16
12
12.3
Share of profit of associates and joint ventures
(12)
(32)
250
238
223
40
263
29
29
12.1
(799)
(73)
(872)
(1,131)
(1,124)
(61)
(11)
(180)
(20.7)%
Income tax expense
8
Non-controlling interests
(211)
(30)
(241)
(357)
(6)
(363)
(26)
(17)
(79)
(32.5)%
(1,283)
(30)
30.7
3,324
2,041
2,682
155
2,836
198
627
(1,501)
6,692
5,191
6,392
52
6,444
Personnel expenses
Amortisation, depreciation
and impairments
Other net (expenses)/income
Sustainability
Review
Other
Information
Financial
Statements
Report
of the
Supervisory
Board
Report
of the
Executive
Board
1 This table will not always cast due to rounding.
2 EBITDA is derived from 'Operating profit' less 'Amortisation, depreciation and impairments' plus 'Share of profit of associates and joint ventures'.
Currency
translation
Consolidation
impact
Organic
growth
Organic
growth
Heineken
N.V.
Annual
Report
2023
Net profit
EBITDA2