211
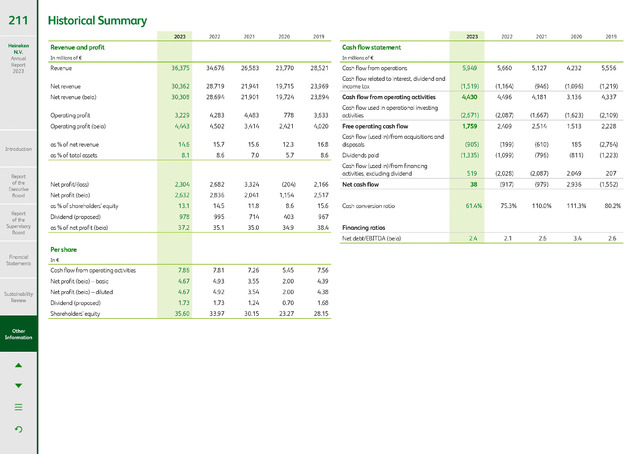
Historical Summary
2023
2022
2021
2020
2019
2023
2022
2021
2020
2019
Cash flow statement
In millions of
Revenue
36,375
34,676
26,583
23,770
28,521
5,949
5,660
5,127
4,232
5,556
(1,519)
(1,164)
(946)
(1,096)
(1,219)
Net revenue
30,362
28,719
21,941
19,715
23,969
Net revenue (beia)
30,308
28,694
21,901
19,724
23,894
4,430
4,496
4,181
3,136
4,337
(2,671)
(2,087)
(1,667)
(1,623)
(2,109)
3,229
4,283
4,483
778
3,633
4,443
4,502
3,414
2,421
4,020
1,759
2,409
2,514
1,513
2,228
as of net revenue
(905)
(199)
(610)
(2,764)
14.6
15.7
15.6
12.3
16.8
185
Introduction
as of total assets
(1,335)
(1,099)
(796)
(811)
(1,223)
8.1
8.6
7.0
5.7
8.6
(2,028)
(2,087)
519
2,049
207
(204)
(917)
(979)
(1,552)
2,304
2,682
3,324
2,166
38
2,936
2,632
2,836
2,041
1,154
2,517
13.1
14.5
11.8
8.6
15.6
Cash conversion ratio
61.4%
75.3%
110.0%
111.3%
80.2%
978
995
714
403
967
37.2
35.1
35.0
34.9
38.4
2.4
2.1
2.6
3.4
2.6
Per share
In
7.86
7.81
7.26
5.45
7.56
4.67
4.93
3.55
2.00
4.39
4.67
4.92
3.54
2.00
4.38
1.73
1.73
1.24
0.70
1.68
35.60
33.97
30.15
23.27
28.15
Financing ratios
Net debt/EBITDA (beia)
Net profit/(loss)
Net profit (beia)
as of shareholders' equity
Dividend (proposed)
as of net profit (beia)
Operating profit
Operating profit (beia)
Cash flow from operating activities
Net profit (beia) - basic
Net profit (beia) - diluted
Dividend (proposed)
Shareholders' equity
Sustainability
Review
Other
Information
Financial
Statements
Report
of the
Supervisory
Board
Report
of the
Executive
Board
Cash flow from operating activities
Cash flow used in operational investing
activities
Free operating cash flow
Cash flow (used in)/from acquisitions and
disposals
Dividends paid
Cash flow (used in)/from financing
activities, excluding dividend
Net cash flow
Cash flow from operations
Cash flow related to interest, dividend and
income tax
Revenue and profit
In millions of
Heineken
N.V.
Annual
Report
2023