178
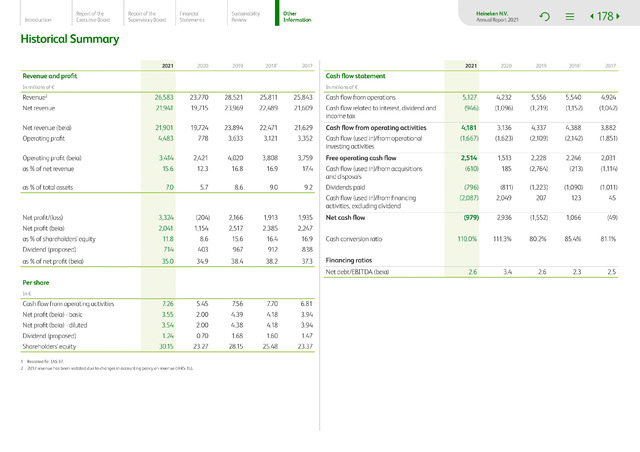
Historical Summary
Introduction
2021
20181
2021
20181
2020
2019
2017
2020
2019
2017
Cash flow statement
In millions of
Net revenue
as of total assets
7.0
5.7
8.6
9.0
9.2
(979)
(1,552)
(49)
2,936
1,066
Cash conversion ratio
110.0%
111.3%
80.2%
85.4%
81.1%
714
403
967
912
838
35.0
34.9
38.4
38.2
37.3
2.6
3.4
2.6
2.3
2.5
Per share
In
7.26
5.45
7.56
7.70
6.81
3.55
2.00
4.39
4.18
3.94
3.54
2.00
4.38
4.18
3.94
1.24
0.70
1.68
1.60
1.47
30.15
23.27
28.15
25.48
23.37
Net revenue (beia)
Operating profit
Operating profit (beia)
as of net revenue
Net profit/(loss)
Net profit (beia)
as of shareholders' equity
Dividend (proposed)
as of net profit (beia)
Cash flow from operating activities
Net profit (beia) - basic
Net profit (beia) - diluted
Dividend (proposed)
Shareholders' equity
Report of the
Executive Board
Report of the
Supervisory Board
26,583
21,941
21,901
4,483
3,324
2,041
11.8
3,414
15.6
Financial
Statements
23,770
19,715
19,724
778
2,421
12.3
(204)
1,154
8.6
23,894
3,633
28,521
23,969
4,020
16.8
2,166
2,517
15.6
Sustainability
Review
25,811
22,489
22,471
3,121
3,808
16.9
1,913
2,385
16.4
Other
Information
25,843
21,609
21,629
3,352
3,759
17.4
1,935
2,247
16.9
Cash flow from operations
Cash flow related to interest, dividend and
income tax
(796)
(2,087)
4,181
(1,667)
2,514
(610)
5,127
(946)
Heineken N.V.
Annual Report 2021
4,232
(1,096)
3,136
(1,623)
(811)
2,049
1,513
185
2,228
(2,764)
(1,223)
207
4,337
(2,109)
5,556
(1,219)
(1,090)
123
4,388
(2,142)
5,540
(1,152)
2,246
(213)
4,924
(1,042)
3,882
(1,851)
(1,011)
45
2,031
(1,114)
1 Restated for IAS 37.
2 2017 revenue has been restated due to changes in accounting policy on revenue (IFRS 15).
Cash flow from operating activities
Cash flow (used in)/from operational
investing activities
Free operating cash flow
Cash flow (used in)/from acquisitions
and disposals
Dividends paid
Cash flow (used in)/from financing
activities, excluding dividend
Net cash flow
Revenue and profit
In millions of
Revenue2
Financing ratios
Net debt/EBITDA (beia)