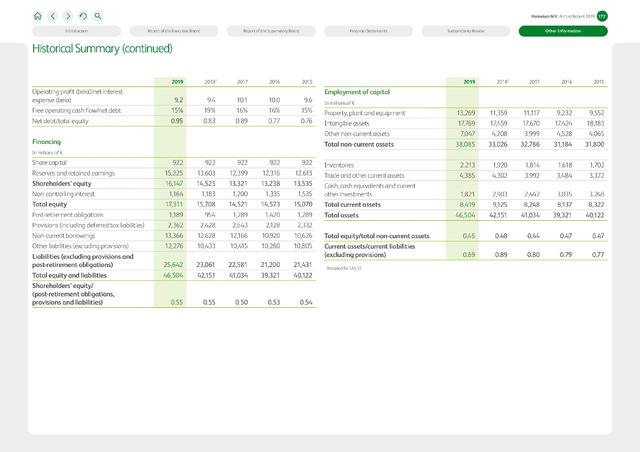
Historical Summary (continued)
Employment of capital
Liabilities (excluding provisions and
(excluding provisions)
post-retirement obligations)
(post-retirement obligations,
O O Qs
Heineken N.V. Annual Report 2019
Report of the Executive Board
Report of the Supervisory Board
Financial Statements
Sustainability Review
Other Information
2019
2018'
2017
2016
2015
2019
20181
2017
2016
2015
Operating profit (beia)/net interest
expense (beia)
9.2
9.4
10.1
10.0
9.6
In millions of
Free operating cash flow/net debt
15%
19%
16%
16%
15%
Property, plant and equipment
13,269
11,359
11,117
9,232
9,552
Net debt/total equity
0.95
0.83
0.89
0.77
0.76
Intangible assets
17,769
17,459
17,670
17,424
18,183
Other non-current assets
7,047
4,208
3,999
4,528
4,065
Financing
Total non-current assets
38,085
33,026
32,786
31,184
31,800
In millions of
Share capital
922
922
922
922
922
Inventories
2,213
1,920
1,814
1,618
1,702
Reserves and retained earnings
15,225
13,603
12,399
12,316
12,613
Trade and other current assets
4,385
4,302
3,992
3,484
3,372
Shareholders' equity
16,147
14,525
13,321
13,238
13,535
Cash, cash equivalents and current
Non-controlling interest
1,164
1,183
1,200
1,335
1,535
other investments
1,821
2,903
2,442
3,035
3,248
Total equity
17,311
15,708
14,521
14,573
15,070
Total current assets
8,419
9,125
8,248
8,137
8,322
Post-retirement obligations
1,189
954
1,289
1,420
1,289
Total assets
46,504
42,151
41,034
39,321
40,122
Provisions (including deferred tax liabilities)
2,362
2,428
2,643
2,128
2,332
Non-current borrowings
13,366
12,628
12,166
10,920
10,626
Total equity/total non-current assets
0.45
0.48
0.44
0.47
0.47
Other liabilities (excluding provisions)
12,276
10,433
10,415
10,280
10,805
Current assets/current liabilities
0.69
0.89
0.80
0.79
0.77
25,642
23,061
22,581
21,200
21,431
1 Restated for IAS 37.
Total equity and liabilities
46,504
42,151
41,034
39,321
40,122
Shareholders' equity/
provisions and liabilities)
0.55
0.55
0.50
0.53
0.54