94
Notes to the Consolidated Financial Statements (continued)
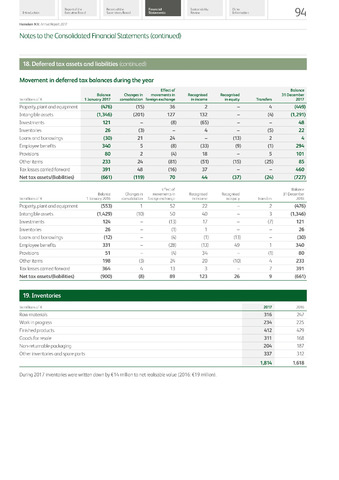
18. Deferred tax assets and liabilities (continued)
Movement in deferred tax balances during the year
-
-
-
-
-
-
-
-
-
-
-
-
-
-
-
-
-
-
-
-
-
-
-
-
19. Inventories
Report of the
Report of the
Financial
Sustainability
Other
Introduction
Executive Board
Supervisory Board
Statements
Review
Information
Heineken N.V. Annual Report 2017
Balance
In millionsof 1 January 2017
Changes in
consolidation
Effect of
movements in
foreign exchange
Recognised
in income
Recognised
in equity
Transfers
Balance
31 December
2017
Property, plant and equipment
(476)
(15)
36
2
4
(449)
Intangible assets
(1,346)
(201)
127
132
(4)
(1,291)
Investments
121
(8)
(65)
48
Inventories
26
(3)
4
(5)
22
Loans and borrowings
(30)
21
24
(13)
2
4
Employee benefits
340
5
(8)
(33)
(9)
(1)
294
Provisions
80
2
(4)
18
5
101
Other items
233
24
(81)
(51)
(15)
(25)
85
Tax losses carried forward
391
48
(16)
37
460
Net tax assets/(liabilities)
(661)
(119)
70
44
(37)
(24)
(727)
In millionsof
Balance
1 January 2016
Changes in
consolidation
Effect of
movements in
foreign exchange
Recognised
in income
Recognised
in equity
Transfers
Balance
31 December
2016
Property, plant and equipment
(553)
1
52
22
2
(476)
Intangible assets
(1,429)
(10)
50
40
3
(1,346)
Investments
124
(13)
17
(7)
121
Inventories
26
(1)
1
26
Loans and borrowings
(12)
(4)
(1)
(13)
(30)
Employee benefits
331
(28)
(13)
49
1
340
Provisions
51
(4)
34
(1)
80
Other items
198
(3)
24
20
(10)
4
233
Tax losses carried forward
364
4
13
3
7
391
Net tax assets/(liabilities)
(900)
(8)
89
123
26
9
(661)
In millionsof
2017
2016
Raw materials
316
247
Work in progress
234
225
Finished products
412
479
Goods for resale
311
168
Non-returnable packaging
204
187
Other inventories and spare parts
337
312
1,814
1,618
During 201 7 inventories were written down by €14 million to net realisable value (2016: €19 million).