89
Notes to the Consolidated Financial Statements (continued)
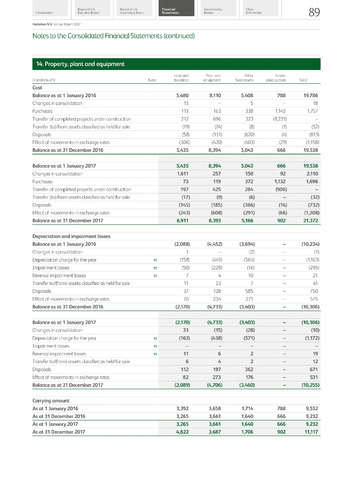
14. Property, plant and equipment
-
-
-
-
-
-
-
-
-
-
-
-
-
-
-
-
-
-
-
-
-
-
-
-
-
-
-
-
Report of the
Report of the
Financial
Sustainability
Other
Introduction
Executive Board
Supervisory Board
Statements
Review
Information
Heineken N.V. Annual Report 2017
Land and
Plant and
Other
Under
In millions of
Note
buildings
equipment
fixed assets
construction
Total
Cost
Balance as at 1 January 2016
5,480
8,110
5,408
788
19,786
Changes in consolidation
13
5
18
Purchases
113
163
338
1,143
1,757
Transfer of completed projects under construction
212
696
323
(1,231)
Transfer (to)/from assets classified as held for sale
(19)
(24)
(8)
(1)
(52)
Disposals
(58)
(131)
(620)
(4)
(813)
Effect of movements in exchange rates
(306)
(420)
(403)
(29)
(1,158)
Balance as at 31 December 2016
5,435
8,394
5,043
666
19,538
Balance as at 1 January 2017
5,435
8,394
5,043
666
19,538
Changes in consolidation
1,611
257
150
92
2,110
Purchases
73
119
372
1,132
1,696
Transfer of completed projects under construction
197
425
284
(906)
Transfer (to)/from assets classified as held for sale
(17)
(9)
(6)
(32)
Disposals
(145)
(185)
(386)
(16)
(732)
Effect of movements in exchange rates
(243)
(608)
(291)
(66)
(1,208)
Balance as at 31 December 2017
6,911
8,393
5,166
902
21,372
Depreciation and impairment losses
Balance as at 1 January 2016
(2,088)
(4,452)
(3,694)
(10,234)
Changes in consolidation
1
(2)
(1)
Depreciation charge for the year
11
(158)
(441)
(564)
(1,163)
Impairment losses
11
(50)
(229)
(16)
(295)
Reversal impairment losses
11
7
4
10
21
Transferto/(from) assets classified as held for sale
11
23
7
41
Disposals
37
128
585
750
Effect of movements in exchange rates
70
234
271
575
Balance as at 31 December 2016
(2,170)
(4,733)
(3,403)
(10,306)
Balance as at 1 January 2017
(2,170)
(4,733)
(3,403)
(10,306)
Changes in consolidation
33
(15)
(28)
(10)
Depreciation charge for the year
11
(163)
(438)
(571)
(1,172)
Impairment losses
11
Reversal impairment losses
11
11
6
2
19
Transferto/(from) assets classified as held for sale
6
4
2
12
Disposals
112
197
362
671
Effect of movements in exchange rates
82
273
176
531
Balance as at 31 December 2017
(2,089)
(4,706)
(3,460)
(10,255)
Carrying amount
As at 1 January 2016
3,392
3,658
1,714
788
9,552
As at 31 December 2016
3,265
3,661
1,640
666
9,232
As at 1 January 2017
3,265
3,661
1,640
666
9,232
As at 31 December 2017
4,822
3,687
1,706
902
11,117