Strong performance
and progress
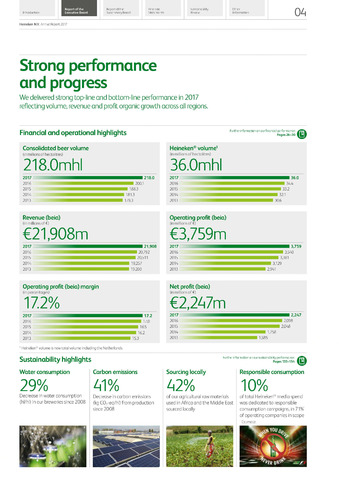
218.0mhl
€21,908m
17.2%
36.0mhl
€3,759m
€2,247m
42%
04
We delivered strong top-line and bottom-line performance in 2017
reflecting volume, revenue and profit organic growth across all regions.
Financial and operational highlights
Consolidated beer volume
Revenue (beia)
Operating profit (beia) margin
Heineken® volume1
Operating profit (beia
Net profit (beia)
Sustainability highlights
Water consumption Carbon emissions
Sourcing locally
Responsible consumption
Report of the
Report of the
Financial
Sustainability
Other
Introduction
Executive Board
Supervisory Board
Statements
Review
Information
Heineken N.V. Annual Report 2017
(in millions of hectolitres)
2017 218.0
2016 200.1
2015 188.3
2014 181.3
2013 178.3
(in millions of
2017 21,908
2016 20,792
2015 20,511
2014 19,257
2013 19,203
(in percentages)
2017 17.2
2016 17.0
2015 16.5
2014 16.2
2013 15.3
1 Heineken® volume is now total volume including the Netherlands.
Further information on our financial performance: 1
Pages 26-30 |U|
(in millions of hectolitres)
(in millions of
2016
3,540
2114
3,381
2014
3,129
2013
2,941
(in millions of
Decrease in water consumption
(hl/hl) in our breweries since 2008
Decrease in carbon emissions
(kg CO2-eq/hl) from production
since 2008
Further information on our sustainability performance:
Pages 133-154
of our agricultural raw materials
used in Africa and the Middle East
sourced locally
of total Heineken® media spend
was dedicated to responsible
consumption campaigns, in 71%1
of operating companies in scope
1 Estimate.