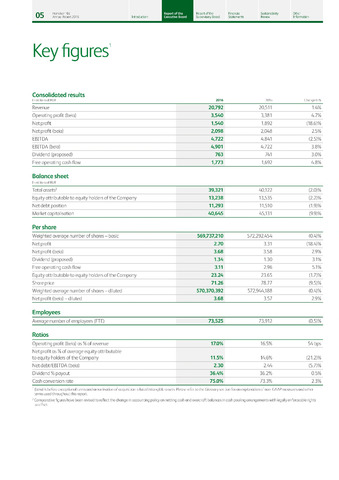
Key figures1
nc
Consolidated results
Balance sheet
Per share
Employees
Ratios
Heineken NV.
Report of the
Report of the
Financial
Sustainability
Other
05
Annual Report 2016
Introduction
Executive Board
Supervisory Board
Statements
Review
Information
In millions of EUR
2016
2015
Change in
Revenue
20,792
20,511
1.4%
Operating profit (beia)
3,540
3,381
4.7%
Net profit
1,540
1,892
(18.6)%
Net profit (beia)
2,098
2,048
2.5%
EBITDA
4,722
4,841
(2.5)%
EBITDA (beia)
4,901
4,722
3.8%
Dividend (proposed)
763
741
3.0%
Free operating cash flow
1,773
1,692
4.8%
In millions of EUR
Total assets2
39,321
40,122
(2.0)%
Equity attributable to equity holders of the Company
13,238
13,535
(2.2)%
Net debt position
11,293
11,510
(1.9)%
Market capitalisation
40,645
45,131
(9.9)%
Weighted average number of shares - basic
569,737,210
572,292,454
(0.4)%
Net profit
2.70
3.31
(18.4)%
Net profit (beia)
3.68
3.58
2.9%
Dividend (proposed)
1.34
1.30
3.1%
Free operating cash flow
3.11
2.96
5.1%
Equity attributable to equity holders of the Company
23.24
23.65
(1.7)%
Share price
71.26
78.77
(9.5)%
Weighted average number of shares - diluted
570,370,392
572,944,188
(0.4)%
Net profit (beia) - diluted
3.68
3.57
2.9%
Average number of employees (FTE)
73,525
73,912
(0.5)%
Operating profit (beia) as of revenue
17.0%
16.5%
54 bps
Net profit as of average equity attributable
to equity holders of the Company
11.5%
14.6%
(21.2)%
Net debt/EBITDA (beia)
2.30
2.44
(5.7)%
Dividend payout
36.4%
36.2%
0.5%
Cash conversion rate
75.0%
73.3%
2.3%
1 (beia) is before exceptional items and amortisation of acquisition-related intangible assets. Please refer to the Glossary section for an explanation of non-GAAP measures and other
terms used throughout this report.
2 Comparative figures have been revised to reflect the change in accounting policy on netting cash and overdraft balances in cash pooling arrangements with legally enforceable rights
to offset.