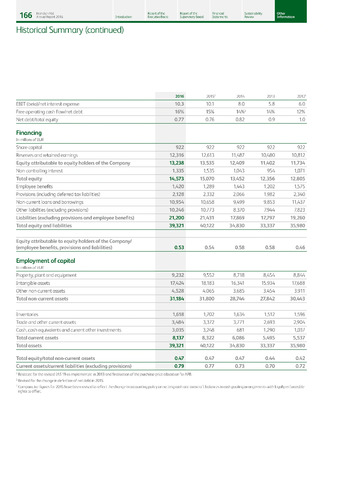
Historical Summary (continued)
Financing
Employment of capital
Report of the Report of the Financial Sustainability
Introduction Executive Board Supervisory Board Statements Review
dd Heineken NV.
I OO Annual Report 2016
Other
Information
2016
20153
2014
2013
2012'
EBIT (beia)/net interest expense
10.3
10.1
8.0
5.8
6.0
Free operating cash flow/net debt
16%
15%
14%2
14%
12%
Net debt/total equity
0.77
0.76
0.82
0.9
1.0
In millions of EUR
Share capital
922
922
922
922
922
Reserves and retained earnings
12,316
12,613
11,487
10,480
10,812
Equity attributable to equity holders of the Company
13,238
13,535
12,409
11,402
11,734
Non-controlling interest
1,335
1,535
1,043
954
1,071
Total equity
14,573
15,070
13,452
12,356
12,805
Employee benefits
1,420
1,289
1,443
1,202
1,575
Provisions (including deferred tax liabilities)
2,128
2,332
2,066
1,982
2,340
Non-current loans and borrowings
10,954
10,658
9,499
9,853
11,437
Other liabilities (excluding provisions)
10,246
10,773
8,370
7,944
7,823
Liabilities (excluding provisions and employee benefits)
21,200
21,431
17,869
17,797
19,260
Total equity and liabilities
39,321
40,122
34,830
33,337
35,980
Equity attributable to equity holders of the Company/
(employee benefits, provisions and liabilities)
0.53
0.54
0.58
0.58
0.46
In millions of EUR
Property, plant and equipment
9,232
9,552
8,718
8,454
8,844
Intangible assets
17,424
18,183
16,341
15,934
17,688
Other non-current assets
4,528
4,065
3,685
3,454
3,911
Total non-current assets
31,184
31,800
28,744
27,842
30,443
Inventories
1,618
1,702
1,634
1,512
1,596
Trade and other current assets
3,484
3,372
3,771
2,693
2,904
Cash, cash equivalents and current other investments
3,035
3,248
681
1,290
1,037
Total current assets
8,137
8,322
6,086
5,495
5,537
Total assets
39,321
40,122
34,830
33,337
35,980
Total equity/total non-current assets
0.47
0.47
0.47
0.44
0.42
Current assets/current liabilities (excluding provisions)
0.79
0.77
0.73
0.70
0.72
1 Restated for the revised IAS 19 as implemented in 2013 and finalisation of the purchase price allocation for APB.
2 Revised for the change in definition of net debt in 2015.
3 Comparative figures for 2015 have been revised to reflect the change in accounting policy on netting cash and overdraft balances in cash pooling arrangements with legally enforceable
rights to offset.