106
Notes to the Consolidated Financial Statements (continued)
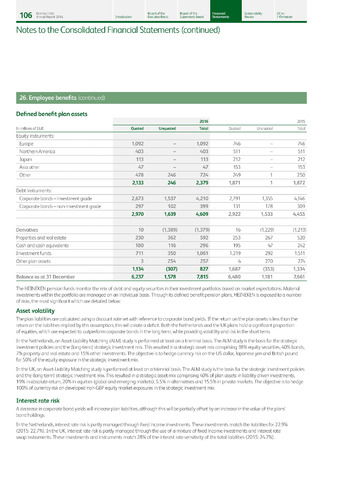
26. Employee benefits (continued)
Defined benefit plan assets
-
-
-
-
-
-
-
-
Asset volatility
Interest rate risk
Heineken NV.
Report of the
Report of the
Financial
Sustainability
Other
Annual Report 2016
Introduction
Executive Board
Supervisory Board
Statements
Review
Information
2016
2015
In millions of EUR
Quoted
Unquoted
Total
Quoted
Unquoted
Total
Equity instruments:
Europe
1,092
1,092
746
746
Northern America
403
403
511
511
Japan
113
113
212
212
Asia other
47
47
153
153
Other
478
246
724
249
1
250
2,133
246
2,379
1,871
1
1,872
Debt instruments:
Corporate bonds - investment grade
2,673
1,537
4,210
2,791
1,355
4,146
Corporate bonds - non-investment grade
297
102
399
131
178
309
2,970
1,639
4,609
2,922
1,533
4,455
Derivatives
10
(1,389)
(1,379)
16
(1,229)
(1,213)
Properties and real estate
230
362
592
253
267
520
Cash and cash equivalents
180
116
296
195
47
242
Investment funds
711
350
1,061
1,219
292
1,511
Other plan assets
3
254
257
4
270
274
1,134
(307)
827
1,687
(353)
1,334
Balance as at 31 December
6,237
1,578
7,815
6,480
1,181
7,661
The HEINEKEN pension funds monitor the mix of debt and equity securities in their investment portfolios based on market expectations. Material
investments within the portfolio are managed on an individual basis. Through its defined benefit pension plans, HEINEKEN is exposed to a number
of risks, the most significant which are detailed below:
The plan liabilities are calculated using a discount rate set with reference to corporate bond yields. If the return on the plan assets is less than the
return on the liabilities implied by this assumption, this will create a deficit. Both the Netherlands and the UK plans hold a significant proportion
of equities, which are expected to outperform corporate bonds in the long term, while providing volatility and risk in the short term.
In the Netherlands, an Asset-Liability Matching (ALM) study is performed at least on a triennial basis. The ALM study is the basis for the strategic
investment policies and the (long-term) strategic investment mix. This resulted in a strategic asset mix comprising 38% equity securities, 40% bonds,
7% property and real estate and 15% other investments. The objective is to hedge currency risk on the US dollar, Japanese yen and British pound
for 50% of the equity exposure in the strategic investment mix.
In the UK, an Asset-Liability Matching study is performed at least on a triennial basis. The ALM study is the basis for the strategic investment policies
and the (long-term) strategic investment mix. This resulted in a strategic asset mix comprising 40% of plan assets in liability driven investments,
19% in absolute return, 20% in equities (global and emerging markets), 5.5% in alternatives and 15.5% in private markets. The objective is to hedge
100% of currency risk on developed non-GBP equity market exposures in the strategic investment mix.
A decrease in corporate bond yields will increase plan liabilities, although this will be partially offset by an increase in the value of the plans'
bond holdings.
In the Netherlands, interest rate risk is partly managed through fixed income investments. These investments match the liabilities for 22.9%
(2015: 22.7%). In the UK, interest rate risk is partly managed through the use of a mixture of fixed income investments and interest rate
swap instruments. These investments and instruments match 28% of the interest rate sensitivity of the total liabilities (2015: 24.7%).