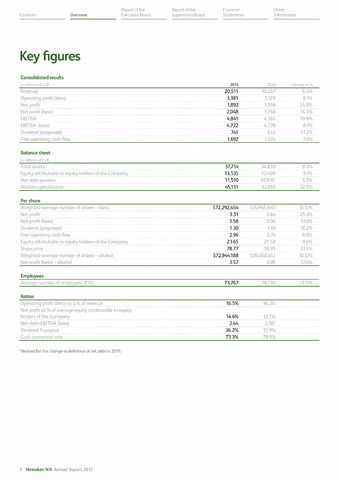
Key figures
Reportofthe Reportofthe Financial Other
Contents Overview Executive Board Supervisory Board Statements Information
Consolidated results
In millions of EUR
2015
Change in
Revenue
20,511
19,257
6.5%
Operating profit (beia)
3,381
3,129
8.1%
Net profit
1,892
1,516
24.8%
Net profit (beia)
2,048
1,758
16.5%
EBITDA
4,841
4,365
10.9%
EBITDA (beia)
4,722
4,370
8.1%
Dividend (proposed)
741
632
17.2%
Free operating cash flow
1,692
1,574
7.5%
Balance sheet
In millions of EUR
Total assets
37,714
34,830
8.3%
Equity attributable to equity holders of the Company
13,535
12,409
9.1%
Net debt position
11,510
10.9101
5.5%
Market capitalisation
45,131
33,955
32.9%
Per share
Weighted average number of shares - basic
572,292,454
574,945,645
(0.5)%
Net profit
3.31
2.64
25.4%
Net profit (beia)
3.58
3.06
17.0%
Dividend (proposed)
1.30
1.10
18.2%
Free operating cash flow
2.96
2.74
8.0%
Equity attributable to equity holders of the Company
23.65
21.58
9.6%
Share price
78.77
58.95
33.6%
Weighted average number of shares - diluted
572,944,188
576,002,613
(0.5)%
Net profit (beia) - diluted
3.57
3.05
17.0%
Employees
Average number of employees (FTE)
73,767
76,136
(3.1)%
Ratios
Operating profit (beia) as a of revenue
16.5%
16.2%
Net profit as of average equity attributable to equity
holders of the Company
14.6%
12.7%
Net debt/EBITDA (beia)
2.44
2.501
Dividend payout
36.2%
35.9%
Cash conversion rate
73.3%
78.9%
1 Revised for the change in definition of net debt in 2015.
3 Heineken N.V. Annual Report 2015