Financial Review continued
Reportofthe Reportofthe Financial Other
Contents Overview Executive Board Supervisory Board Statements Information
Cash flow
In millions of EUR
2015
Cash flow from operations before changes in working capital and provisions
4,280
4,279
Total change in working capital
371
27
Change in provisions and employee benefits
(165)
(166)
Cash flow from operations
4,486
4,140
Cash flow related to interest, dividend and income tax
(997)
(1,082)
Cash flow from operating activities
3,489
3,058
Cash flow (used in)/from operational investing activities
(1,797)
(1,484)
Free operating cash flow
1,692
1,574
Cash flow (used in)/from acquisitions and disposals
(267)
(189)
Cash flow (used in)/from financing activities
(1,173)
(2,453)
Net cash flow
252
(1,068)
Cash conversion ratio
73%
79%
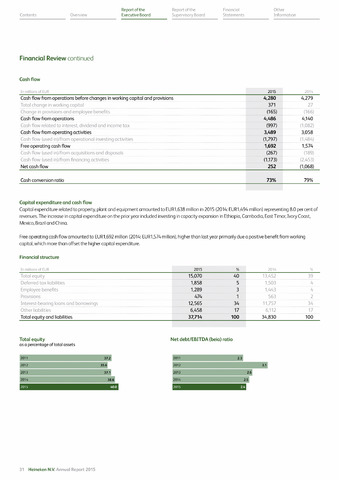
Capital expenditure and cash flow
Capital expenditure related to property, plant and equipment amounted to EUR1,638 million in 2015 (2014: EUR1.494 million) representing 8.0 per cent of
revenues. The increase in capital expenditure on the prior year included investing in capacity expansion in Ethiopia, Cambodia, East Timor, Ivory Coast,
Mexico, Brazil and China.
Free operating cash flow amounted to EUR1,692 million (2014: EUR1,574 million), higher than last year primarily due a positive benefit from working
capital, which more than offset the higher capital expenditure.
Financial structure
In millions of EUR
2015
Total equity
15,070
40
13,452
39
Deferred tax liabilities
1,858
5
1,503
4
Employee benefits
1,289
3
1,443
4
Provisions
474
1
563
2
Interest-bearing loans and borrowings
12,565
34
11,757
34
Other liabilities
6,458
17
6,112
17
Total equity and liabilities
37,714
100
34,830
100
Total equity Net debt/EBITDA (beia) ratio
as a percentage of total assets
2011
37.2
2011
2.3
2012
35.6
2012
3.1
2013
37.1
2013
2.6
2012,
38.6
2014
25|
12015
40.0
31 Heineken N.V. Annual Report 2015