-
-
-
-
-
-
-
-
-
-
-
-
-
-
-
-
-
Contents
Overview
Report of the
Executive Board
Report of the
Supervisory Board
Financial
statements
Other
information
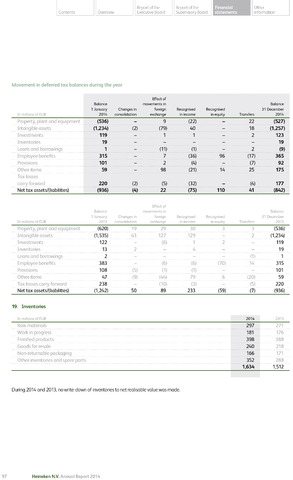
Movement in deferred tax balances during the year
In millions of EUR
Balance
1 January
2014
Changes in
consolidation
Effect of
movements in
foreign
exchange
Recognised
in income
Recognised
in equity
Transfers
Balance
31 December
2014
Property, plant and equipment
(536)
9
(22)
22
(527)
Intangible assets
(1,234)
(2)
(79)
40
18
(1,257)
Investments
119
1
1
2
123
Inventories
19
19
Loans and borrowings
1
(11)
(1)
2
(9)
Employee benefits
315
7
(36)
96
(17)
365
Provisions
101
2
(4)
(7)
92
Other items
59
98
(21)
14
25
175
Tax losses
carry forward
220
(2)
(5)
(32)
(4)
177
Net tax assets/(liabilities)
(936)
(4)
22
(75)
110
41
(842)
Effect of
Balance movements in Balance
1 January Changes in foreign Recognised Recognised 31 December
In millions of EUR 2013 consolidation exchange in income inequity Transfers 2013
(620) 19 29 30 3 3 (536)
Intangible assets (1,535) 43 127 129 - 2 (1,234)
Investments 122 - (6) 1 2 - 119
Inventories 13 2 - 4 - - 19
Loans and borrowings 2 - - - - (1) 1
383 - (6) (6) (70) 14 315
Provisions 108 (5) (1)(1) - - 101
47 (9) (44) 79 6 (20) 59
Tax losses carry forward 238 - (10) (3) - (5) 220
Net tax assets/(liabilities) (1,242) 50 89 233 (59) (7) (936)
19. Inventories
In millions of EUR
2014
2013
Raw materials
297
271
Work in progress
181
176
Finished products
398
388
Goods for resale
240
218
Non-returnable packaging
166
171
Other inventories and spare parts
352
288
1,634 1,512
During 2014 and 2013, no write-down of inventories to net realisable value was made.
97
Heineken N.V. Annual Report 2014