Report of the
Report of the
Financial
Other
Contents
Overview
Executive Board
Supervisory Board
statements
information
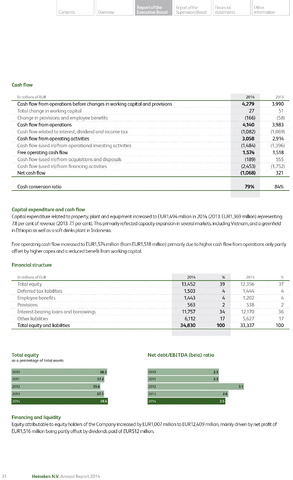
Cash flow
In millions of EUR
2014
2013
Cash flow from operations before changes in working capital and provisions
4,279
3,990
Total change in working capital
27
51
Change in provisions and employee benefits
(166)
(58)
Cash flow from operations
4,140
3,983
Cash flow related to interest, dividend and income tax
(1,082)
(1,069)
Cash flow from operating activities
3,058
2,914
Cash flow (used in)/from operational investing activities
(1,484)
(1,396)
Free operating cash flow
1,574
1,518
Cash flow (used in)/from acquisitions and disposals
(189)
555
Cash flow (used in)/from financing activities
(2,453)
(1,752)
Net cash flow
(1,068)
321
Cash conversion ratio
79%
84%
Capital expenditure and cash flow
Capital expenditure related to property, plant and equipment increased to EUR1,494 million in 2014 (2013: EUR1,369 million) representing
7.8 per cent of revenue (2013: 7.1 percent). This primarily reflected capacity expansion in several markets, including Vietnam, and a greenfield
in Ethiopia as well as a soft drinks plant in Indonesia.
Free operating cashflow increased to EUR1,574 million (from EUR1,518 million) primarily due to higher cash flow from operations only partly
offset by higher capex and a reduced benefit from working capital.
Financial structure
In millions of EUR
2014
2013
Total equity
13,452
39
12,356
37
Deferred tax liabilities
1,503
4
1,444
4
Employee benefits
1,443
4
1,202
4
Provisions
563
2
538
2
Interest-bearing loans and borrowings
11,757
34
12,170
36
Other liabilities
6,112
17
5,627
17
Total equity and liabilities
34,830
100
33,337
100
Total equity Net debt/EBITDA (beia) ratio
as a percentage of total assets
2010
38.3
2010
2.3
2011
37.2
2011
2.3
2012
35.6
2012
3.1
2013
37.1
2013
2.6
2014
38.6
Financing and liquidity
Equity attributable to equity holders of the Company increased by EUR1,007 million to EUR12,409 million, mainly driven by net profit of
EUR1,516 million being partly offset by dividends paid of EUR512 million.
31
Heineken N.V. Annual Report 2014