Notes to the consolidated financial statements continued
Report of the
Report of the
Financial
Other
Contents
Overview
Executive Board
Supervisory Board
statements
information
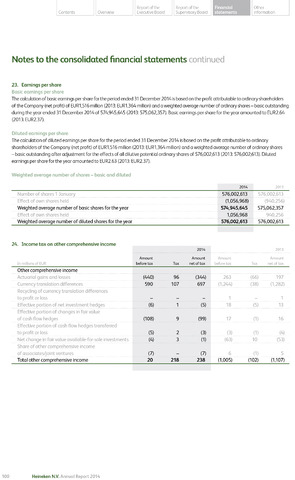
23. Earnings per share
Basic earnings per share
The calculation of basic earnings per share for the period ended 31 December 2014 is based on the profit attributable to ordinary shareholders
of the Company (net profit) of EUR1,516 million (2013: EUR1.364 million) and a weighted average number of ordinary shares-basic outstanding
during the year ended 31 December 2014 of 574,94 5,645 (2013: 575,062,357). Basic earnings per share for the year amounted to EUR2.64
(2013: EUR2.37).
Diluted earnings per share
The calculation of diluted earnings per share for the period ended 31 December 2014 is based on the profit attributable to ordinary
shareholders of the Company (net profit) of EUR1,516 million (2013: EUR1.364 million) and a weighted average number of ordinary shares
-basic outstanding after adjustment for the effects of all dilutive potential ordinary shares of 576,002,613 (2013: 576,002,613). Diluted
earnings per share for the year amounted to EUR2.63 (2013: EUR2.37).
Weighted average number of shares - basic and diluted
2014 2013
576,002,613
Effect of own shares held (1,056,968) (940,256)
Weighted average number of basic shares for the year 574,945,645 575,062,357
Effect of own shares held 1,056,968 940,256
Weighted average number of diluted shares for the year 576,002,613 576,002,613
24. Income tax on other comprehensive income
In millions of EUR
2014
2013
Amount Amount
before tax Tax net of tax
Amount Amount
before tax Tax net of tax
Other comprehensive income
Actuarial gains and losses
(440) 96 (344)
263 (66) 197
Currency translation differences
590 107 697
(1,244) (38) (1,282)
Recycling of currency translation differences
to profit or loss
1 - 1
Effective portion of net investment hedges
(6) 1 (5)
18 (5) 13
Effective portion of changes in fair value
of cashflow hedges
(108) 9 (99)
17 (1) 16
Effective portion of cash flow hedges transferred
to profit or loss
(5) 2 (3)
(3) (1) (4)
Net change in fair value available-for-sale investments
(4) 3 (1)
(63) 10 (53)
Share of other comprehensive income
of associates/joint ventures
(7) - (7)
6 (1) 5
Total other comprehensive income
20 218 238
(1,005) (102) (1,107)
100
Heineken N.V. Annual Report 2014