-
-
-
-
-
-
-
-
-
-
-
-
-
-
-
-
-
-
-
-
-
-
-
-
-
-
Report of the Report of the
Contents Overview Executive Board Supervisory Board
Financial
statements
Other information
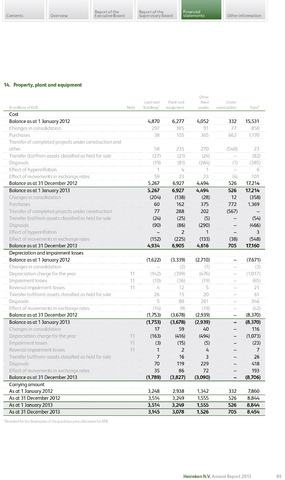
14. Property, plant and equipment
Other
Land and Plant and fixed Under
In millions of EUR Note buildings* equipment assets construction Total*
Cost
Balance as at 1 January 2012
4,870
6,277
4,052
332
15,531
Changes in consolidation
297
385
91
77
850
Purchases
38
105
365
662
1,170
Transfer of completed projects under construction and
other
58
235
270
(540)
23
Transfer (to)/from assets classified as held for sale
(37)
(21)
(24)
(82)
Disposals
(19)
(81)
(284)
(1)
(385)
Effect of hyperinflation
1
4
1
6
Effect of movements in exchange rates
59
23
23
(4)
101
Balance as at 31 December 2012
5,267
6,927
4,494
526
17,214
Balance as at 1 January 2013
5,267
6,927
4,494
526
17,214
Changes in consolidation
(204)
(138)
(28)
12
(358)
Purchases
60
162
375
772
1,369
Transfer of completed projects under construction
77
288
202
(567)
Transfer (to)/from assets classified as held for sale
(24)
(25)
(5)
(54)
Disposals
(90)
(86)
(290)
(466)
Effect of hyperinflation
2
1
3
Effect of movements in exchange rates
(152)
(225)
(133)
(38)
(548)
Balance as at 31 December 2013
4,934
6,905
4,616
705
17,160
Depreciation and impairment losses
Balance as at 1 January 2012
(1,622)
(3,339)
(2,710)
(7,671)
Changes in consolidation
(2)
(1)
(3)
Depreciation charge for the year
11
(142)
(399)
(476)
(1,017)
Impairment losses
11
(10)
(36)
(19)
(65)
Reversal impairment losses
11
4
12
5
21
Transfer to/(from) assets classified as held for sale
26
15
20
61
Disposals
5
80
261
346
Effect of movements in exchange rates
(14)
(9)
(19)
(42)
Balance as at 31 December 2012
(1,753)
(3,678)
(2,939)
(8,370)
Balance as at 1 January 2013
(1,753)
(3,678)
(2,939)
(8,370)
Changes in consolidation
17
59
40
116
Depreciation charge for the year
11
(163)
(416)
(494)
(1,073)
Impairment losses
11
(3)
(15)
(5)
(23)
Reversal impairment losses
11
1
2
4
7
Transfer to/(from) assets classified as held for sale
7
16
3
26
Disposals
70
119
229
418
Effect of movements in exchange rates
35
86
72
193
Balance as at 31 December 2013
(1,789)
(3,827)
(3,090)
(8,706)
Carrying amount
As at 1 January 2012
3,248
2,938
1,342
332
7,860
As at 31 December 2012
3,514
3,249
1,555
526
8,844
As at 1 January 2013
3,514
3,249
1,555
526
8,844
As at 31 December 2013
3,145
3,078
1,526
705
8,454
Restated for the finalisation of the purchase price allocation for APB.
Heineken N.V. Annual Report 2013
89