-
-
-
-
-
-
-
-
-
-
Report of the Report of the
Contents Overview Executive Board Supervisory Board
Financial
statements
Other information
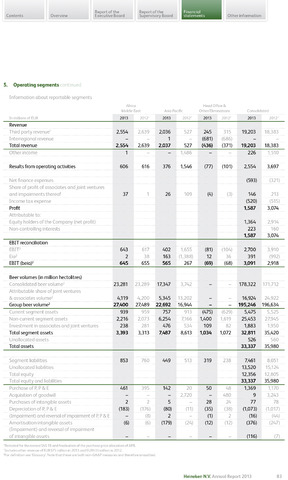
5. Operating segments
Information about reportable segments
Africa Head Office
Middle East Asia Pacific Other/Eliminations Consolidated
In millions of EUR
2013
2012*
2013
2012*
2013
2012*
2013
2012*
Revenue
2,554
2,554
2.036
1
2.037
245
(681)
(436)
19,203
19,203
Third party revenue1
2,639
527
315
18,383
Interregional revenue
(686)
Total revenue
2,639
527
(371)
18,383
Other income
1
1,486
226
1,510
Results from operating activities
606
37
616
376
26
1,546
(77)
(4)
(101)
2,554
(593)
146
(520)
1,587
1,364
3,697
Net finance expenses
(321)
Share of profit of associates and joint ventures
and impairments thereof
1
109
(3)
213
Income tax expense
(515)
Profit
3,074
Attributable to:
Equity holders of the Company (net profit)
2,914
Non-controlling interests
223
160
1,587
3,074
EBIT reconciliation
(81)
12
2,700
391
EBIT2
643
617
402
1,655
(104)
3,910
Eia2
2
38
163
(1,388)
36
(992)
EBIT (beia)2
645
655
565
267
(69)
(68)
3,091
2,918
Beer volumes (in million hectolitres)
178,322
16,924
195,246
Consolidated beer volume2
23,281
23,289
17,347
3,742
171,712
Attributable share of joint ventures
associates volume2
4,119
27,400
4,200
5,345
22,692
13,202
24,922
Group beer volume2
27,489
16,944
196,634
Current segment assets
939
959
757
913
(475)
1,400
109
1,034
(629)
5,475
25,453
1,883
32,811
526
33,337
5,525
Non-current segment assets
2,216
2,073
6,254
7,166
1,619
27,945
Investment in associates and joint ventures
238
281
476
7,487
534
82
1,950
Total segment assets
3,393
3,313
8,613
1,072
35,420
Unallocated assets
560
Total assets
35,980
319
Segment liabilities
853
760
449
513
238
7,461
8,051
Unallocated liabilities
13,520
12,356
33,337
15,124
Total equity
12,805
Total equity and liabilities
35,980
Purchase of P, P&E
461
2
(183)
(6)
395
142
5
(80)
2
(179)
20
50
28
(35)
(1)
(12)
48
1,369
9
77
(1,073)
(16)
(376)
(116)
1,170
Acquisition of goodwill
2,720
480
3,243
Purchases of intangible assets
2
24
78
Depreciation of P, P E
(176)
(11)
(38)
(1,017)
(Impairment) and reversal of impairment of P, P E
(8)
2
(44)
Amortisation intangible assets
(6)
(24)
(12)
(247)
(Impairment) and reversal of impairment
of intangible assets
(7)
*Restated for the revised IAS 19 and finalisation of the purchase price allocation of APB.
includes other revenue of EUR375 million in 2013 and EUR433 million in 2012.
2For definition see 'Glossary'. Note that these are both non-GAAP measures and therefore unaudited.
Heineken N.V. Annual Report 2013
83