m
Financial Review continued
Contents
Overview
Report of the
Executive Board
Report of the
Supervisory Board
Financial
statements
Other information
Cash flow
In millions of EUR
2013
2012*
Cash flow from operations before changes in working capital and provisions
3,990
3,581
Total change in working capital
51
101
Change in provisions and employee benefits
(58)
(164)
Cash flow from operations
3,983
3,518
Cash flow related to interest, dividend and income tax
(1,069)
(823)
Cash flow from operating activities
2,914
2,695
Cash flow (used in)/from operational investing activities
(1,396)
(1,210)
Free operating cash flow
1,518
1,485
Cash flow (used in)/from acquisitions and disposals
555
(4,415)
Cash flow (used in)/from financing activities
(1,752)
3,056
Net cash flow
321
126
Cash conversion ratio
84%
82%
*Restated for the revised IAS 19.
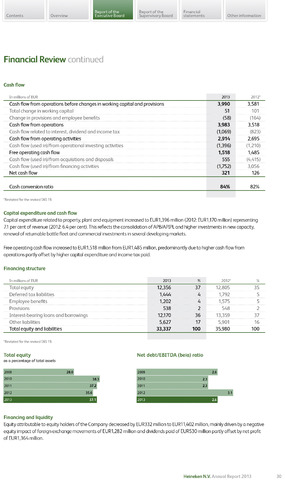
Capital expenditure and cash flow
Capital expenditure related to property, plant and equipment increased to EUR1,396 million (2012: EUR1.170 million) representing
7.1 percent of revenue (2012: 6.4 per cent). This reflects the consolidation of APB/APIPLand higher investments in new capacity,
renewal of returnable bottle fleet and commercial investments in several developing markets.
Free operating cashflow increased to EUR1,518 million from EUR1,485 million, predominantly due to higher cash flow from
operations partly offset by higher capital expenditure and income tax paid.
Financing structure
In millions of EUR
2013
2012*
Total equity
12,356
37
12,805
35
Deferred tax liabilities
1,444
4
1,792
5
Employee benefits
1,202
4
1,575
5
Provisions
538
2
548
2
Interest-bearing loans and borrowings
12,170
36
13,359
37
Other liabilities
5,627
17
5,901
16
Total equity and liabilities
33,337
100
35,980
100
*Restated for the revised IAS 19.
Total equity Net debt/EBITDA (beia) ratio
as a percentage of total assets
2009 28.0
2009
2.6
2010
38.3
2010
2.3
2011
37.2
2011
2.3
2012
35.6
2012
3.1
2013
37.1
2013
Financing and liquidity
Equity attributable to equity holders of the Company decreased by EUR332 million to EUR11,402 million, mainly driven by a negative
equity impact of foreign exchange movements of EUR1,282 million and dividends paid of EUR530 million partly offset by net profit
of EUR1,364 million.
Heineken N.V. Annual Report 2013
30