Report of the Report of the
Overview Executive Board Supervisory Board Other information
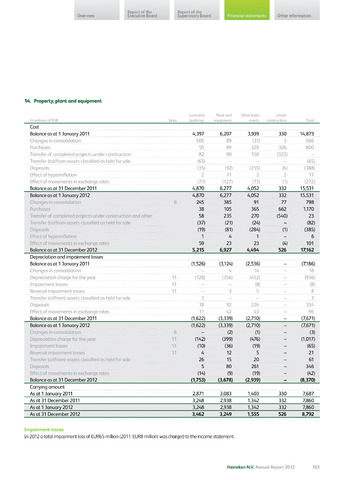
14. Property, plant and equipment
Land and
Plant and
Other fixed
Under
In millions of EUR
Note
buildings
equipment
assets
construction
Total
Cost
Balance as at 1 January 2011
4,397
6,207
3,939
330
14,873
Changes in consolidation
505
89
(31)
3
566
Purchases
55
99
320
326
800
Transfer of completed projects under construction
82
90
150
(322)
-
Transfer (to)/from assets classified as held for sale
(65)
-
-
-
(65)
Disposals
(35)
(92)
(255)
(6)
(388)
Effect of hyperinflation
2
11
2
2
17
Effect of movements in exchange rates
(71)
(127)
(73)
(1)
(272)
Balance as at 31 December 2011
4,870
6,277
4,052
332
15,531
Balance as at 1 January 2012
4,870
6,277
4,052
332
15,531
Changes in consolidation
6
245
385
91
77
798
Purchases
38
105
365
662
1,170
Transfer of completed projects under construction and other
58
235
270
(540)
23
Transfer (to)/from assets classified as held for sale
(37)
(21)
(24)
-
(82)
Disposals
(19)
(81)
(284)
(1)
(385)
Effect of hyperinflation
1
4
1
-
6
Effect of movements in exchange rates
59
23
23
(4)
101
Balance as at 31 December 2012
5,215
6,927
4,494
526
17,162
Depreciation and impairment losses
Balance as at 1 January 2011
(1,526)
(3,124)
(2,536)
-
(7,186)
Changes in consolidation
4
14
-
18
Depreciation charge for the year
11
(128)
(356)
(452)
-
(936)
Impairment losses
11
-
-
(8)
-
(8)
Reversal impairment losses
11
-
3
5
-
8
Transfer to/(from) assets classified as held for sale
3
-
-
-
3
Disposals
18
92
224
-
334
Effect of movements in exchange rates
11
42
43
-
96
Balance as at 31 December 2011
(1,622)
(3,339)
(2,710)
-
(7,671)
Balance as at 1 January 2012
(1,622)
(3,339)
(2,710)
-
(7,671)
Changes in consolidation
6
-
(2)
(1)
-
(3)
Depreciation charge for the year
11
(142)
(399)
(476)
-
(1,017)
Impairment losses
11
(10)
(36)
(19)
-
(65)
Reversal impairment losses
11
4
12
5
-
21
Transfer to/(from) assets classified as held for sale
26
15
20
-
61
Disposals
5
80
261
-
346
Effect of movements in exchange rates
(14)
(9)
(19)
-
(42)
Balance as at 31 December 2012
(1,753)
(3,678)
(2,939)
-
(8,370)
Carrying amount
As at 1 January 2011
2,871
3,083
1,403
330
7,687
As at 31 December 2011
3,248
2,938
1,342
332
7,860
As at 1 January 2012
3,248
2,938
1,342
332
7,860
As at 31 December 2012
3,462
3,249
1,555
526
8,792
Impairment losses
In 2012 a total impairment lossof EUR65 million (2011: EUR8 million) was charged to the income statement.
Heineken N.V. Annual Report 2012
103