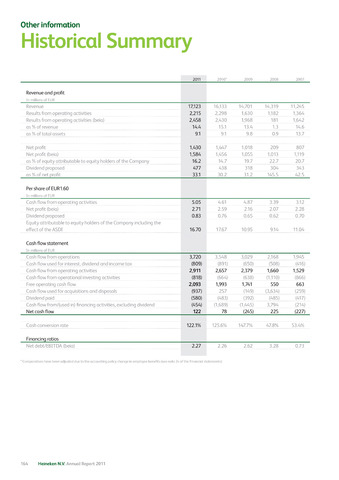
Historical Summary
Other information
2011
2010*
2009
2008
2007
Revenue and profit
Revenue
17,123
16,133
14,701
14,319
11,245
Results from operating activities
2,215
2,298
1,630
1,182
1,364
Results from operating activities (beia)
2,458
2,430
1,968
181
1,642
as of revenue
14.4
15.1
13.4
1.3
14.6
as of total assets
9.1
9.1
9.8
0.9
13.7
Net profit
1,430
1,447
1,018
209
807
Net profit (beia)
1,584
1,456
1,055
1,013
1,119
as of equity attributable to equity holders of the Company
16.2
14.7
19.7
22.7
20.7
Dividend proposed
477
438
318
304
343
33.1
30.2
31.2
145.5
42.5
Per share of EUR1.60
Cash flow from operating activities
5.05
4.61
4.87
3.39
3.12
Net profit (beia)
2.71
2.59
2.16
2.07
2.28
Dividend proposed
0.83
0.76
0.65
0.62
0.70
Equity attributable to equity holders of the Company including the
effect of the ASDI
16.70
17.67
10.95
9.14
11.04
Cash flow statement
Cash flow from operations
3,720
3,548
3,029
2,168
1,945
Cash flow used for interest, dividend and income tax
(809)
(891)
(650)
(508)
(416)
Cash flow from operating activities
2,911
2,657
2,379
1,660
1,529
Cash flow from operational investing activities
(818)
(664)
(638)
(1,110)
(866)
Free operating cash flow
2,093
1,993
1,741
550
663
Cash flow used for acquisitions and disposals
(937)
257
(149)
(3,634)
(259)
Dividend paid
(580)
(483)
(392)
(485)
(417)
Cash flow from/(used in) financing activities, excluding dividend
(454)
(1,689)
(1,445)
3,794
(214)
Net cash flow
122
78
(245)
225
(227)
Cash conversion rate
122.1%
125.6%
147.7%
47.8%
53.4%
Financing ratios
Net debt/EBITDA (beia)
2.27
2.26
2.62
3.28
0.73
Comparatives have been adjusted due to the accounting policy change in employee benefits (see note 2e of the Financial statements)
164 Heineken N.V. Annual Report 2011