Financial statements I Notes to the consolidated financial statements continued
m
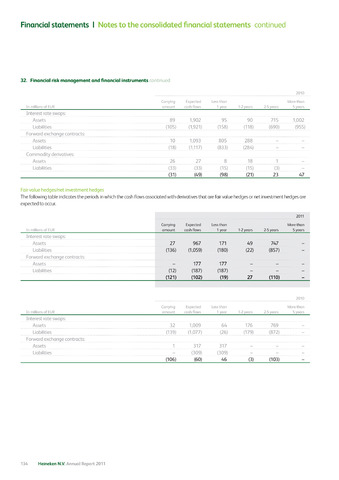
32. Financial risk management and financial instruments :ontinued
2010
In millions of EUR
Carrying
amount
Expected
cash flows
Less than
1 year
1-2 years
2-5 years
More than
5 years
Interest rate swaps:
Assets
89
1,902
95
90
715
1,002
Liabilities
(105)
(1,921)
(158)
(118)
(690)
(955)
Forward exchange contracts:
Assets
10
1,093
805
288
-
-
Liabilities
(18)
(1,117)
(833)
(284)
-
-
Commodity derivatives:
Assets
26
27
8
18
1
-
Liabilities
(33)
(33)
(15)
(15)
(3)
-
(31)
(98)
(21)
23
47
Fair value hedges/net investment hedges
The following table indicates the periods in which the cash flows associated with derivatives that are fair value hedges or net investment hedges are
expected to occur.
2011
Carrying
amount
Expected
cash flows
Less than
1 year
1-2 years
2-5 years
More than
5 years
Interest rate swaps:
Assets
27
967
171
49
747
-
Liabilities
(136)
(1,059)
(180)
(22)
(857)
-
Forward exchange contracts:
Assets
-
177
177
-
-
-
Liabilities
(12)
(187)
(187)
-
-
-
(121)
(102)
(19)
27
(110)
-
2010
In millions of EUR
Carrying
amount
Expected
cash flows
Less than
1 year
1-2 years
2-5 years
More than
5 years
Interest rate swaps:
Assets
32
1,009
64
176
769
-
Liabilities
(139)
(1,077)
(26)
(179)
(872)
-
Forward exchange contracts:
Assets
1
317
317
-
-
-
Liabilities
-
(309)
(309)
-
-
-
(106)
(60)
46
(3)
(103)
-
134 Heineken N.V. Annual Report 2011