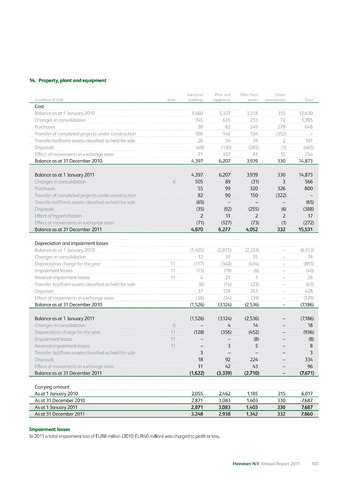
14. Property, plant and equipment
Land and
Plant and
Other fixed
Under
In millions of EUR
Note
buildings
equipment
assets
construction
Total
Cost
Balance as at 1 January 2010
3,460
5,337
3,518
315
12,630
Changes in consolidation
745
635
253
72
1,705
Purchases
38
82
249
279
648
Transfer of completed projects under construction
106
142
104
(352)
-
Transfer to/(from) assets classified as held for sale
26
34
39
2
101
Disposals
(49)
(130)
(285)
(1)
(465)
Effect of movements in exchange rates
71
107
61
15
254
Balance as at 31 December 2010
4,397
6,207
3,939
330
14,873
Balance as at 1 January 2011
4,397
6,207
3,939
330
14,873
Changes in consolidation
6
505
89
(31)
3
566
Purchases
55
99
320
326
800
Transfer of completed projects under construction
82
90
150
(322)
-
Transfer to/(from) assets classified as held for sale
(65)
-
-
-
(65)
Disposals
(35)
(92)
(255)
(6)
(388)
Effect of hyperinflation
2
11
2
2
17
Effect of movements in exchange rates
(71)
(127)
(73)
(1)
(272)
Balance as at 31 December 2011
4,870
6,277
4,052
332
15,531
Depreciation and impairment losses
Balance as at 1 January 2010
(1,405)
(2,875)
(2,333)
-
(6,613)
Changes in consolidation
12
31
35
-
78
Depreciation charge for the year
11
(117)
(342)
(434)
-
(893)
Impairment losses
11
(15)
(19)
(6)
-
(40)
Reversal impairment losses
11
4
21
1
-
26
Transfer (to)/from assets classified as held for sale
(6)
(14)
(23)
-
(43)
Disposals
37
128
263
-
428
Effect of movements in exchange rates
(36)
(54)
(39)
-
(129)
Balance as at 31 December 2010
(1,526)
(3,124)
(2,536)
-
(7,186)
Balance as at 1 January 2011
Changes in consolidation
6
(1,526)
(3,124)
4
(2,536)
14
-
(7,186)
18
Depreciation charge for the year
11
(128)
(356)
(452)
-
(936)
Impairment losses
11
-
-
(8)
-
(8)
Reversal impairment losses
11
-
3
5
-
8
Transfer (to)/from assets classified as held for sale
3
-
-
-
3
Disposals
18
92
224
-
334
Effect of movements in exchange rates
Balance as at 31 December 2011
11
(1,622)
42
(3,339)
43
(2,710)
-
96
(7,671)
Carrying amount
Asatl January 2010
2,055
2,462
1,185
315
6,017
As at 31 December 2010
2,871
3,083
1,403
330
7,687
As at 1 January 2011
2,871
3,083
1,403
330
7,687
As at 31 December 2011
3,248
2,938
1,342
332
7,860
Impairment losses
In 2011 a total impairment loss of EUR8 million (2010: EUR40 million) was charged to profit or loss.
Heineken N.V. Annual Report 2011 103