95
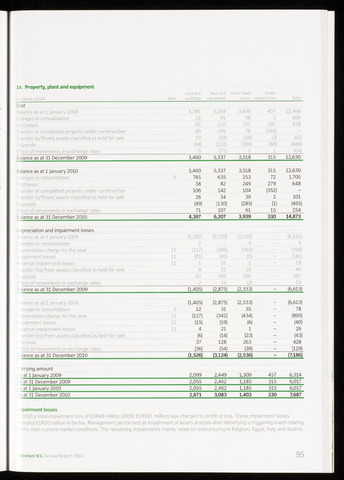
14. Property, plant and equipment
In millions of EUR
Land and
Note buildings
Plant and
equipmi
Other fixed
assets
Under
construction
Cost
Balance as at 1 January 2009
Changes in consolidation
3,381
5,169
91
110
199
(39)
3,459
457
12,466
15
(9)
3
100
Purchases
45
232
78
291
678
Transfer of completed projects under construction
89
(366)
Transfer to/(from) assets classified as held for sale
19
(39)
(3)
(62)
Disposals
Effect of movements in exchange rates
(94)
5
(122)
(71)
(204)
(68)
1
(488)
Balance as at 31 December 2009
3,460
5,337
3,518
315
12,630
Balance as at 1 January 2010
3,460
5,337
3,518
315
12,630
Changes in consolidation
745
635
253
72
1,705
P irehases
38
82
249
279
648
Transfer of completed projects under construction
106
142
104
(352)
-
1 ansfer to/(from) assets classified as held for sale
26
34
39
2
101
Disposals
(49)
(130)
(285)
(1)
(465)
f feet of movements in exchange rates
71
107
61
15
254
E ilance as at 31 December 2010 4,397 6,207 3,939 330 14,873
preciation and impairment losses
alance as at 1 January 2009
(1,282)
(2,720)
(2,150)
(6,152)
anges in consolidation
2
3
5
epreciation charge for the year
11
(117)
(286)
(365)
(768)
:pairment losses
11
(81)
(95)
(5)
(181)
versal impairment losses
11
1
16
1
18
ansfer (to)/from assets classified as held for sale
8
22
19
49
iisposals
ect of movements in exchange rates
62
169
19
166
(2)
397
19
ilance as at 31 December 2009
(1,405)
(2,875)
(2,333)
-
(6,613)
ilance as at 1 January 2010
tanges in consolidation
6
(1,405)
12
(2,875)
31
(2,333)
35
-
(6,613)
78
apreciation charge for the year
11
(117)
(342)
(434)
-
(893)
pairment losses
11
(15)
(19)
(6)
-
(40)
versal impairment losses
11
4
21
1
-
26
ansfer (to)/from assets classified as held for sale
(6)
(14)
(23)
-
(43)
posals
37
128
263
-
428
feet of movements in exchange rates
(36)
(54)
(39)
-
(129)
iance as at 31 December 2010
(1,526)
(3,124)
(2,536)
-
(7,186)
irrying amount
at 1 January 2009
2,099
2,449
1,309
457
6,314
at 31 December 2009
2,055
2,462
1,185
315
6,017
at 1 January 2010
2,055
2,462
1,185
315
6,017
at 31 December 2010
2,871
3,083
1,403
330
7,687
ipairment losses
2010 a total impairment loss of EUR40 million (2009: EUR181 million) was charged to profit or loss. These impairment losses
eluded EUR20 million in Serbia. Management performed an impairment of assets analysis after identifying a triggering event relating
the then current market conditions. The remaining impairments mainly relate to restructuring in Belgium, Egypt, Italy and Austria.
iineken N.V. Annual Report 2010