37
Despite the increase of 15 per cent in the weighted average number of shares, diluted earnings per share increased
from EUR2.08 to EUR2.55.
Cash flow
2010
Cash flow from operations before changes in working capital and provisions
Total change in working capital
Change in provisions and employee benefits
3,299
454
(205)
2,876
220
Cash flow from operations
Cash flow related to interest, dividend and income tax
3,548
(891)
3,029
Cash flow from operating activities
Cash flow used in operational investing activities
2,657
(664)
2,379
Free operating cash flow
Cash flow used for acquisitions and disposals
ash flow from/fused in) financing activities
1,993
257
(2,172)
1,741
(149)
(1,837)
Net cash flow
78
(245)
^ash conversion ratio
126%
148%
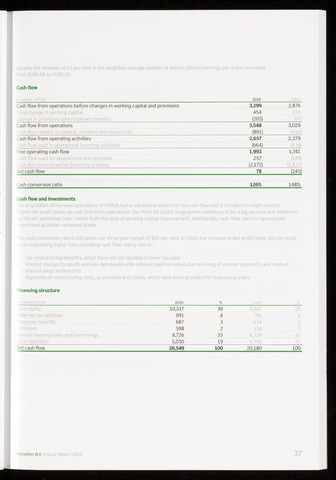
lash flow and investments
The acquisition of the beer operations of FEMSA had a substantial impact on the cash flow and is included for eight months.
Higher net profit drove up cash flow from operations. Our Hunt for Cash2 programme continued to be a big success and delivered
significant additional cash, mainly from the area of working capital improvement. Additionally, cash flow used for operational
nvestment activities remained stable.
The cash conversion rate is still above our three-year target of 100 per cent. In 2010, the increase in Net profit (beia) did not result
i corresponding higher free operating cash flow mainly due to:
Tax restructuring benefits, which have not yet resulted in lower tax paid
Interest charged to profit and loss decreased while interest paid increased due to timing of interest payments and related
interest swap settlements
Payments of restructuring costs, guarantees and claims, which have been provided for in previous years,
nancing structure
2010
ital equity
10,517
39
5,647
Jeferred tax liabilities
991
4
786
4
nployee benefits
687
3
634
3
'revisions
598
2
518
3
nterest-bearing loans and borrowings
8,726
33
8,239
41
ther liabilities
5,030
19
4,356
21
Net cash flow
26,549
100
20,180
100
teineken N.V. Annual Report 2010