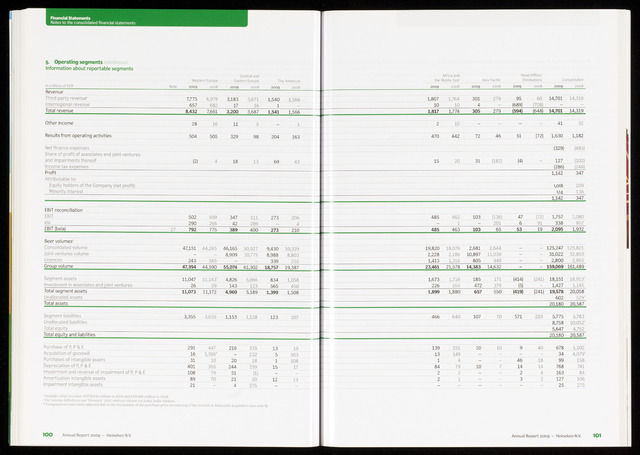
5- Operating segments
lOO Annual Report 2009 - Heineken N.V.
Financial Statements
Notes to the consolidated financial statements
Information about reportable segments
Western Europe
Central and
Eastern Europe
The Americas
In millions of EUR
2009
2008
2009
2008
2009
2008
Revenue
Third-party revenue'
7,775
6,979
3,183
3,671
1,540
1,566
Interregional revenue
657
682
17
16
1
Total revenue
8,432
7,661
3,200
3,687
1,541
1,566
Other income
28
16
11
5
-
1
Results from operating activities
504
505
329
98
204
163
Net finance expenses
Share of profit of associates and joint ventures
and impairments thereof (2) 4 18 13 69 43
Income tax expenses
Profit
Attributable to:
Equity holders of the Company (net profit)
Minority interest
EBIT reconciliation
EBIT
502
509
347
111
273
206
eia
290
266
42
289
4
EBIT (beia)
27
792
775
389
400
273
210
Beer volumes2
Consolidated volume
47,151
44,245
46,165
50,527
9,430
10,329
Joint ventures volume
-
8,909
10,775
8,988
8,803
Licences
243
345
339
255
Group volume
47,394
44,590
55,074
61,302
18,757
19,387
Segment assets 11,047 11,143" 4,826 5,066 834 1,058
Investment in associates and joint ventures2629143 123 565 450
Total segment assets 11,073 11,172 4,969 5,189 1,399 1,508
Unallocated assets
Total assets
Segment liabilities 3,355 3,635 1,153 1,128 123 107
Unallocated liabilities
Total equity
Total equity and liabilities
Purchase of P, P E
291
447
216
335
13
19
Acquisition of goodwill
16
3,395*
232
5
303
Purchases of intangible assets
31
10
20
18
1
108
Depreciation of P, P E
401
365
244
259
15
17
Impairment and reversal of impairment of P, P E
108
79
51
(1)
Amortisation intangible assets
89
70
21
20
12
13
Impairment intangible assets
21
4
275
Includes other revenue of EUR432 million in 2009 and EUR360 million in 2008.
2 For volume definitions see 'Glossary'. Joint venture volume excludes India volumes.
Comparatives have been adjusted due to the finalisation of the purchase price accounting of the Scottish Newcastle acquisition (see note 6).
Africa and Head Office/
the Middle East Asia Pacific Eliminations Consolidated
2009
2008
2009
2008
2009
2008
2009
2008
1,807
1,764
301
279
95
60
14,701
14,319
10
10
4
(689)
(708)
-
1,817
1,774
305
279
(594)
(648)
14,701
14,319
2
10
-
-
-
-
41
32
470
442
72
46
51
(72)
1,630
1,182
(329)
(485)
15
20
31
(182)
(4)
127
(102)
(286)
(248)
1,142
347
1,018
209
124 138
1,142 347
485 462 103 (136) 47 (72) 1,757 1,080
-12016 91 338 852
485 463 103 65 53 19 2,095 1,932
19,820
18,076
2,681
2,644
-
-
125,247
125,821
2,228
2,186
10,897
11,039
-
-
31,022
32,803
1,413
1,316
805
949
-
-
2,800
2,865
23,461
21,578
14,383
14,632
-
-
159,069
161,489
1,673
1,716
185
171
(414)
(241)
18,151
18,913'
226
164
472
379
(5)
1,427
1,145
1,899
1,880
657
550
(419)
(241)
19,578
20,058
602
529"
20,180
20,587
466
640
107
70
571
203
5,775
5,783
8,758
10,052"
5,647
4,752
20,180
20,587
139
251
10
10
9
40
678
1,102
13
149
-
-
-
-
34
4,079"
1
4
-
-
46
18
99
158
84
79
10
7
14
14
768
741
2
2
-
2
4
163
84
2
1
-
3
2
127
106
25
275
Annual Report 2009 - Heineken N.V.
IOI