€3,687 million
€111 million
€400 million
50.5 million hectolitres
2.8 million hectolitres
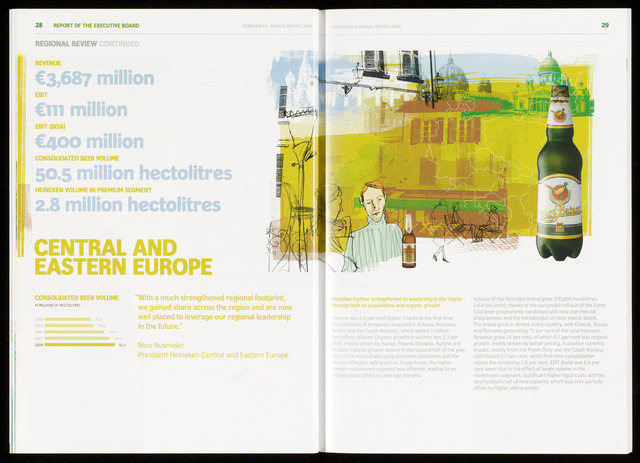
CENTRAL AND
EASTERN EUROPE
28 REPORT OF THE EXECUTIVE BOARD
REGIONAL REVIEW CONTINUED
REVENUE
EBJT
EBIT (BEIA)
CONSOUDATED BEER VOLUME
HEINEKEN VOLUME IN PREMIUM SEGMENT
CONSOLIDATED BEER VOLUME
'With a much strengthened regional footprint,
we gained share across the region and are now
well placed to leverage our regional leadership
in the future."
Nico Nusmeier
President Heineken Central and Eastern Europe
HEINEKEN N.V. ANNUAL REPORT 2008
HEINEKEN N.V. ANNUAL REPORT 2008
IN MILLIONS OF HECTOLITRES
2004
2005 ■■■■■■■■■■■■■I
2006
2007
2008 WBÊÊÊÊÊÊÊÊM 50.5
Heineken further strengthened its leadership in the region
through bolt-on acquisitions and organic growth.
Volume was 8.8 per cent higher, thanks to the first-time
consolidation of breweries acquired in Belarus, Romania,
Serbia and the Czech Republic, which added 3 million
hectolitres of beer. Organic growth in volume was 2.3 per
cent, mainly driven by Russia, Poland, Slovakia, Austria and
Croatia. Volume growth slowed in the second half of the year
due to the more challenging economic conditions and the
impact of higher selling prices. In particular, the higher
margin mainstream segment was affected, leading to an
unfavourable effect on average margins.
Volume of the Heineken brand grew 170,000 hectolitres
(+6.6 per cent), thanks to the successful roll-out of the Extra
Cold beer programme, combined with new commercial
programmes and the introduction of clear plastic labels.
The brand grew in almost every country, with Greece, Russia
and Romania generating 71 per cent of the total increase.
Revenue grew 14 per cent, of which 8.7 per cent was organic
growth, mainly driven by better pricing. A positive currency
impact, mostly from the Polish Zloty and the Czech Koruna,
contributed 1.7 per cent, whilst first-time consolidation
added the remaining 3.9 per cent. EBIT (beia) was 6.6 per
cent lower due to the effect of lower volume in the
mainstream segment, significant higher input costs and the
depreciation cost of new capacity, which was only partially
offset by higher selling prices.