160 OTHER INFORMATION
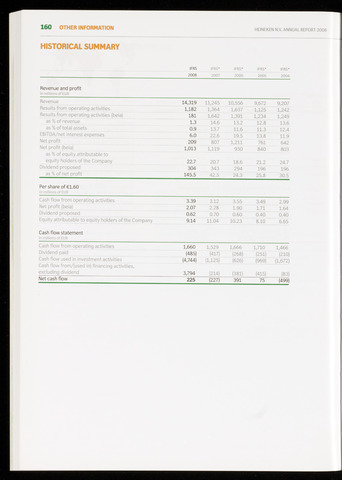
HISTORICAL SUMMARY
HEINEKEN N.V. ANNUAL REPORT 2008
IFRS IFRS* IFRS* IFRS* IFRS*
2008 2007 2006 2005 2004
Revenue and profit
In millions of EUR
Revenue
14,319
11,245
10,556
9,672
9,207
Results from operating activities
1,182
1,364
1,637
1,125
1,242
Results from operating activities (beia)
181
1,642
1,391
1,234
1,249
as of revenue
1.3
14.6
13.2
12.8
13.6
as of total assets
0.9
13.7
11.6
11.3
12.4
EBITDA/net interest expenses
6.0
22.6
19.5
13.8
11.9
Net profit
209
807
1,211
761
642
Net profit (beia)
1,013
1,119
930
840
803
as of equity attributable to
equity holders of the Company
22.7
20.7
18.6
21.2
24.7
Dividend proposed
304
343
294
196
196
as of net profit 145.5 42.5 24.3 25.8 30.5
Per share of €1.60
In millions of EUR
Cash flow from operating activities 3.39 3.12 3.55 3.49 2.99
Net profit (beia)
2.07
2.28
1.90
1.71
1.64
Dividend proposed
0.62
0.70
0.60
0.40
0.40
Equity attributable to equity holders of the Company 9.14 11.04 10.23 8.10 6.65
Cash flow statement
In millions of EUR
Cash flow from operating activities
1,660
1,529
1,666
1,710
1,466
Dividend paid
(485)
(417)
(268)
(251)
(210)
Cash flow used in investment activities
(4,744)
(1,125)
(626)
(969)
(1,672)
Cash flow from/fused in) financing activities,
excluding dividend
3,794
(214)
(381)
(415)
(83)
Net cash flow
225
(227)
391
75
(499)