PERFORMANCE
HIGHLIGHTS
Heineken
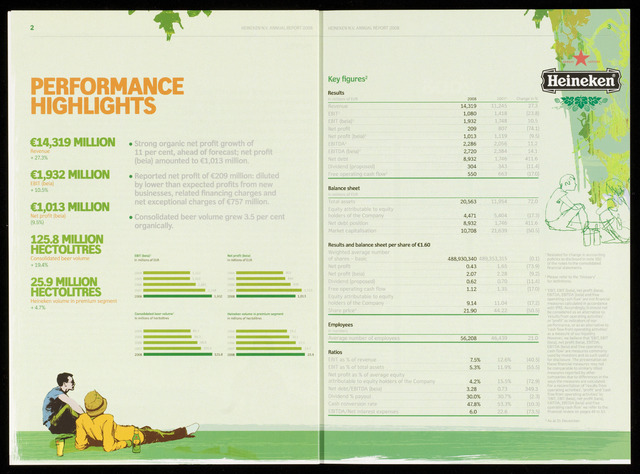
€14,319 MILLION
€1,932 MILLION
€1,013 MILLION
125.8 MILLION
HECTOLITRES
25.9 MILLION
HECTOLITRES
2
Strong organic net profit growth of
11 per cent, ahead of forecast; net profit
(beia) amounted to €1,013 million.
Reported net profit of €209 million: diluted
by lower than expected profits from new
businesses, related financing charges and
net exceptional charges of €757 million.
Consolidated beer volume grew 3.5 per cent
organically.
3
Key figures2
HEINEKEN N.V. ANNUAL REPORT 2008
Revenue
27.3%
EBIT (beia)
10.5%
Net profit (beia)
(9.5%)
Consolidated beer volume
19.4%
Heineken volume in premium segment
4.7%
EBIT (beia)1
In millions of EUR
Net profit (beia)
In millions of EUR
2007 I
2008 I
1,932 2008 I
Consolidated beer volume1
In millions of hectolitres
Heineken volume in premium segment
In millions of hectolitres
1,013
125.8 2008 I
HEINEKEN N.V. ANNUAL REPORT 2008
Results
In millions of EUR
2008
2007'
Change in
Revenue
14,319
11,245
27.3
EBIT'
1,080
1,418
(23.8)
EBIT (beia)3
1,932
1,748
10.5
Net profit
209
807
(74.1)
Net profit (beia)3
1,013
1,119
(9.5)
EBITDA3
2,286
2,056
11.2
EBITDA (beia)3
2,720
2,384
14.1
Net debt
8,932
1,746
411.6
Dividend (proposed)
304
343
(11.4)
Free operating cash flow3
550
(17.0)
Balance sheet
In millions of EUR
Total assets
20,563
11,954
72.0
Equity attributable to equity
holders of the Company
4,471
5,404
(17.3)
Net debt position
8,932
1,746
411.6
Market capitalisation
10,708
21,639
(50.5)
Results and balance sheet per share of €1.60
Weighted average number
of shares - basic
488,930,340
(0.1)
Net profit
0.43
1.65
(73.9)
Net profit (beia)
2.07
2.28
(9.2)
Dividend (proposed)
0.62
0.70
(11.4)
Free operating cash flow
1.12
1.35
(17.0)
Equity attributable to equity
holders of the Company
9.14
11.04
(17-2)
Share price4
21.90
(50.5)
Employees
In numbers
56,208
Ratios
EBIT as of revenue
7.5%
12.6%
(40.5)
EBIT as of total assets
5.3%
11.9%
(55.5)
Net profit as of average equity
attributable to equity holders of the Company
4.2%
15.5%
(72.9)
Net debt/EBITDA (beia)
3.28
0.73
349.3
Dividend payout
30.0%
30.7%
(2.3)
Cash conversion rate
47.8%
53.3%
(10.3)
VNet interest expenses
6.0
(73.5)
9
1 Restated for change in accounting
policies as disclosed in note 3(b)
of the notes to the consolidated
financial statements.
2 Please refer to the 'Glossary'
for definitions.
3 'EBIT, EBIT (beia), net profit (beia),
EBITDA, EBITDA (beia) and free
operating cash flow' are not financial
measures calculated in accordance
with IFRS. Accordingly, it should not
be considered as an alternative to
'results from operating activities'
or'profit' as indicators of our
performance, or as an alternative to
'cash flow from operating activities'
as a measure of our liquidity.
However, we believe that 'EBIT, EBIT
(beia), net profit (beia), EBITDA,
EBITDA (beia) and free operating
cash flow' are measures commonly
used by investors and as such useful
for disclosure. The presentation on
these financial measures may not
be comparable to similarly titled
measures reported by other
companies due to differences in the
ways the measures are calculated.
For a reconciliation of'results from
operating activities', 'profit' and 'cash
flow from operating activities' to
'EBIT, EBIT (beia), net profit (beia),
EBITDA, EBITDA (beia) and free
operating cash flow' we refer to the
financial review on pages 49 to 53.
As at 31 December.