Financial Statements
Notes to the consolidated financial statements
continued
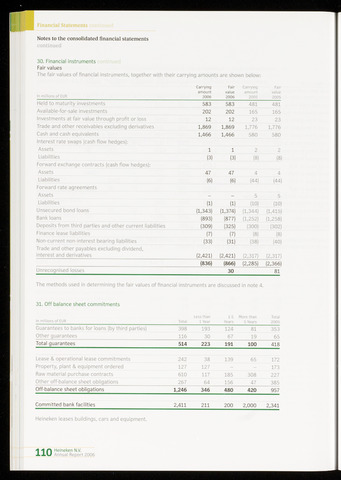
30. Financial instruments
Fair values
The fair values of financial instruments, together with their carrying amounts are shown below:
Carrying
Fair
Carrying
Fair
amount
value
amount
value
In millions of EUR
2006
2006
2005
2005
Field to maturity investments
583
583
481
481
Available-for-sale investments
202
202
165
165
Investments at fair value through profit or loss
12
12
23
23
Trade and other receivables excluding derivatives
1,869
1,869
1,776
1,776
Cash and cash equivalents
1,466
1,466
580
580
Interest rate swaps (cash flow hedges):
Assets
1
1
2
2
Liabilities
(3)
(3)
(8)
(8)
Forward exchange contracts (cash flow hedges):
Assets
47
47
4
4
Liabilities
(6)
(6)
(44)
(44)
Forward rate agreements
Assets
-
-
5
5
Liabilities
(1)
(1)
(10)
(10)
Unsecured bond loans
(1,343)
(1,374)
(1,344)
(1,415)
Bank loans
(893)
(877)
(1,252)
(1,258)
Deposits from third parties and other current liabilities
(309)
(325)
(300)
(302)
Finance lease liabilities
(7)
(7)
(8)
(8)
Non-current non-interest bearing liabilities
(33)
(31)
(38)
(40)
Trade and other payables excluding dividend,
interest and derivatives
(2,421)
(2,421)
(2,317)
(2,317)
(836)
(866)
(2,285)
(2,366)
Unrecognised losses
30
81
The methods used in determining the fair values of financial instruments are discussed in note 4.
31. Off balance sheet commitments
Less than
1-5
More than
Total
In millions of EUR
Total
1 Year
Years
5 Years
2005
Guarantees to banks for loans (by third parties)
398
193
124
81
353
Other guarantees
116
30
67
19
65
Total guarantees
514
223
191
100
418
Lease operational lease commitments
242
38
139
65
172
Property, plant equipment ordered
127
127
173
Raw material purchase contracts
610
117
185
308
227
Other off-balance sheet obligations
267
64
156
47
385
Off-balance sheet obligations
1,246
346
480
420
957
Committed bank facilities
2,411
211
200
2,000
2,341
Fleineken leases buildings, cars and equipment.
1 1 O Fleineken N.V.
IXU Annual Report 2006