73 Heineken N.V. Annual Report 2004 Report of the Executive Board Financial Review
2004
Cash flow
in millions of euros
Cash flow from operating activities
Dividends paid
Cash flow from investing activities
Borrowings
Repayments on loans
Other financing
1,520
-243
-1,671
-394
201
-324
-2
-519
2003
1,637
-241
-2,080
-684
1,501
-271
3
549
Cash flow and investments
The cash flow from operating activities decreased from €1,637 million in 2003 to €1,520 million in
2004, due mainly to higher interest and tax payments.
Net investments in tangible fixed assets amounted to €637 million in 2004, compared with €611
million in 2003. In addition to investments in Spain (€74 million), there was substantial expenditure
in Nigeria (€66 million), Poland (€58 million), the Netherlands (€60 million), France (€70 million)
and Italy (€53 million).
A total of €1,049 million was invested in new acquisitions and expanding existing interests,
compared with €1,344 million in 2003. This related to the second phase of the Brau Union acquisition
in Austria (39.7%), Shikan Brewery (95.1%), Volga Brewery (100%) and Sobol Brewery (100%),
the increased stake in Dinal (48%) and the acquisition of several beverage wholesalers in Europe.
Financing and liquidity
Group equity decreased from €3,899 million as at 31 December 2003 to €3,862 million as at
31 December 2004. Shareholders' equity increased from €3,167 million to €3,379 million.
The net profit of €537 million, net revaluations of €33 million and positive exchange rate effects
of €2 million were offset by the dividend distribution of €173 million and the effect of implementation
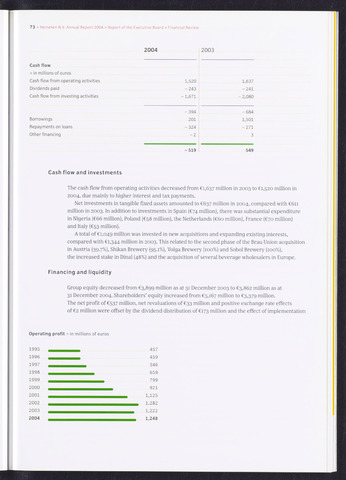
Operating profit in millions of euros
1995 457
1996 459
1997 546
1998 659
1999 799
2000 921
2001 1>125
2002 ammmm1,282
2003 1,222
2004 1,248