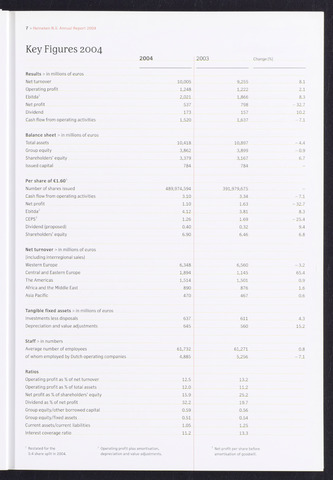
Key Figures 2004
7 Heineken N.V. Annual Report 2004
2004
Results in millions of euros
Net turnover
10,005
9,255
8.1
Operating profit
1,248
1,222
2.1
Ebitda'
2,021
1,866
8.3
Net profit
537
798
-32.7
Dividend
173
157
10.2
Cash flow from operating activities
1,520
1,637
-7.1
Balance sheet in millions of euros
Total assets
10,418
10,897
-4.4
Group equity
3,862
3,899
-0.9
Shareholders' equity
3,379
3,167
6.7
Issued capital
784
784
Per share of C1.601
Number of shares issued
489,974,594
391,979,675
Cash flow from operating activities
3.10
3.34
-7.1
Net profit
1.10
1.63
-32.7
Ebitda2
4.12
3.81
8.3
CEPS3
1.26
1.69
-25.4
Dividend (proposed)
0.40
0.32
9.4
Shareholders' equity
6.90
6.46
6.8
Net turnover in millions of euros
(including interregional sales)
Western Europe
6,348
6,560
-3.2
Central and Eastern Europe
1,894
1,145
65.4
The Americas
1,514
1,501
0.9
Africa and the Middle East
890
876
1.6
Asia Pacific
470
467
0.6
Tangible fixed assets in millions of euros
Investments less disposals
637
611
4.3
Depreciation and value adjustments
645
560
15.2
Staff in numbers
Average number of employees
61,732
61,271
0.8
of whom employed by Dutch operating companies
4,885
5,256
-7.1
Ratios
Operating profit as of net turnover
12.5
13.2
Operating profit as of total assets
12.0
11.2
Net profit as of shareholders' equity
15.9
25.2
Dividend as of net profit
32.2
19.7
Group equity/other borrowed capital
0.59
0.56
Group equity/fixed assets
0.51
0.54
Current assets/current liabilities
1.05
1.25
Interest coverage ratio
11.2
13.3
2003
Change
1 Restated for the
5:4 share split in 2004.
2 Operating profit plus amortisation,
depreciation and value adjustments.
3 Net profit per share before
amortisation of goodwill.