102 Heineken N.V. Annual Report 2004 Financial Statements 2004 Segmented Information
Balance sheet
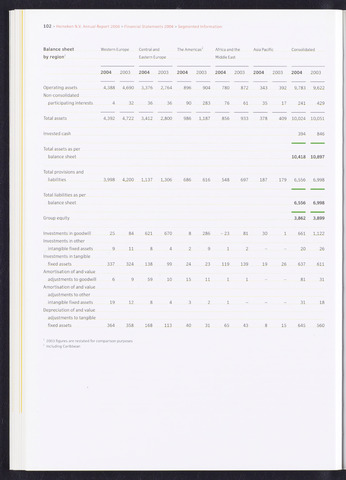
by region1
Western Europe
Central and
Eastern Europe
The Americas
Africa and the
Middle East
Asia Pacific
Consolidated
2004 2003 2004 2003 2004 2003 2004 2003 2004 2003 2004 2003
Operating assets 4,388 4,690 3,376 2,764 896 904 780 872 343 392 9,783 9,622
Non-consolidated
participating interests 4 32 36 36 90 283 76 61 35 17 241 429
Total assets
4,392 4,722 3,412 2,800 986 1,187 856 933 378 409 10,024 10,051
Invested cash
394 846
Total assets as per
balance sheet
10,418 10,897
Total provisions and
liabilities
3,998 4,200 1,137 1,306 686 616 548 697 187 179 6,556 6,998
Total liabilities as per
balance sheet
6,556 6,998
Group equity
3,862 3,899
Investments in goodwill
Investments in other
intangible fixed assets
Investments in tangible
fixed assets
Amortisation of and value
adjustments to goodwill
Amortisation of and value
adjustments to other
intangible fixed assets
Depreciation of and value
adjustments to tangible
fixed assets
25
337
6
19
84 621 670
11
286 -23 81
30
324
9
12
138
59
99
10
15 11
1 661 1,122
20 26
24 23 119 139 19 26 637 611
81 31
31 18
364 358 168 113
40 31 65 43
15 645 560
1 2003 figures are restated for comparison purposes
2 Including Caribbean