97 Heineken N.V. Annual Report 2004 Financial Statements 2004 Notes to the Consolidated Profit and Loss Account
2004
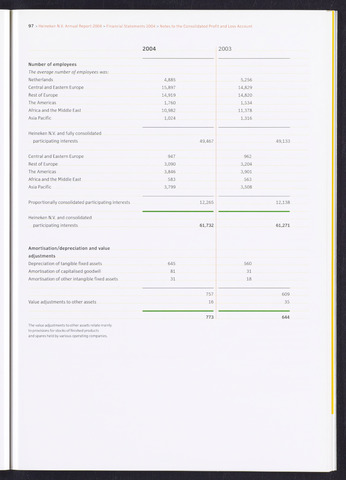
Number of employees
The average number of employees was:
Netherlands
Central and Eastern Europe
Rest of Europe
The Americas
Africa and the Middle East
Asia Pacific
Heineken N.V. and fully consolidated
participating interests
Central and Eastern Europe
Rest of Europe
The Americas
Africa and the Middle East
Asia Pacific
Proportionally consolidated participating interests
Heineken N.V. and consolidated
participating interests
Amortisation/depreciation and value
adjustments
Depreciation of tangible fixed assets
Amortisation of capitalised goodwill
Amortisation of other intangible fixed assets
Value adjustments to other assets
The value adjustments to other assets relate mainly
to provisions for stocks of finished products
and spares held by various operating companies.
4,885
15,897
14,919
1,760
10,982
1,024
947
3,090
3,846
583
3,799
645
81
31
49,467
12,265
61,732
757
16
773
2003
5,256
14,829
14,820
1,534
11,378
1,316
962
3,204
3,901
563
3,508
560
31
18
49,133
12,138
61,271
609
35
644