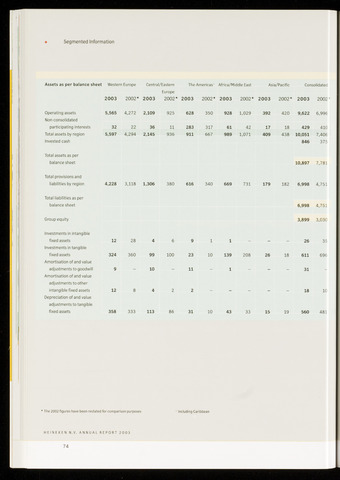
Segmented Information
Assets as per balance sheet Western Europe Central/Eastern The Americas' Africa/Middle East Asia/Pacific Consolidated
Europe
2003 2002* 2003 2002* 2003 2002* 2003 2002* 2003 2002* 2003 2002
Operating assets
Non-consolidated
participating interests
Total assets by region
Invested cash
5,565 4,272 2,109 925
32 22 36 11
5,597 4,294 2,145 936
628 350 928 1,029 392 420 9,622 6,996
283 317 61 42 17 18
911 667 989 1,071 409 438
429
10,051
846
410
7,406
375
Total assets as per
balance sheet
10,897 7,781
Total provisions and
liabilities by region
4,228 3,118 1,306
380
616
340
669
731
179
182 6,998 4,751
Total liabilities as per
balance sheet
6,998 4,751
Group equity
3,899 3,030
Investments in intangible
fixed assets
Investments in tangible
fixed assets
Amortisation of and value
adjustments to goodwill
Amortisation of and value
adjustments to other
intangible fixed assets
Depreciation of and value
adjustments to tangible
fixed assets
12
28
324 360 99 100
10
12
358 333 113
23
11
26 35
10 139 208 26 18 611 696
31
18 10
86
31
10 43
33
15 19 560 481
The 2002 figures have been restated for comparison purposes 1 Including Caribbean
HEINEKEN N.V. ANNUAL REPORT 2003
74