2003
2003 2002 Change
Financial Review
2002
Change
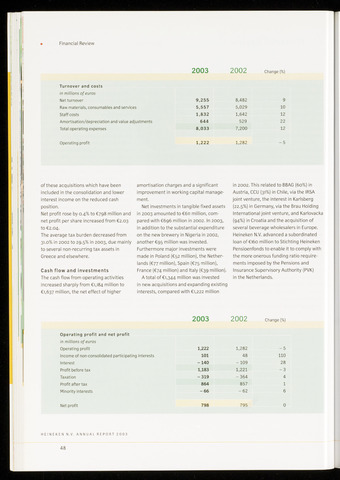
Turnover and costs
in millions of euros
Net turnover
9,255
8,482
9
Raw materials, consumables and services
5,557
5,029
10
Staff costs
1,832
1,642
12
Amortisation/depreciation and value adjustments
644
529
22
Total operating expenses
8,033
7,200
12
Operating profit 1,222 1,282 -5
of these acquisitions which have been
included in the consolidation and lower
interest income on the reduced cash
position.
Net profit rose by 0.4% to €798 million and
net profit per share increased from €2.03
to €2.04.
The average tax burden decreased from
31.0% in 2002 to 29.5% in 2003, due mainly
to several non-recurring tax assets in
Greece and elsewhere.
Cash flow and investments
The cash flow from operating activities
increased sharply from €1,184 million to
€1,637 million, the net effect of higher
amortisation charges and a significant
improvement in working capital manage
ment.
Net investments in tangible fixed assets
in 2003 amounted to €611 million, com
pared with €696 million in 2002. In 2003,
in addition to the substantial expenditure
on the new brewery in Nigeria in 2002,
another €95 million was invested.
Furthermore major investments were
made in Poland (€52 million), the Nether
lands (€77 million), Spain (€75 million),
France (€74 million) and Italy (€39 million).
A total of €1,344 million was invested
in new acquisitions and expanding existing
interests, compared with €1,222 million
in 2002. This related to BBAG (60%) in
Austria, CCU (31%) in Chile, via the IRSA
joint venture, the interest in Karlsberg
(22.5%) in Germany, via the Brau Holding
International joint venture, and Karlovacka
(94%) in Croatia and the acquisition of
several beverage wholesalers in Europe.
Fieineken N.V. advanced a subordinated
loan of €160 million to Stichting Fieineken
Pensioenfonds to enable it to comply with
the more onerous funding ratio require
ments imposed by the Pensions and
Insurance Supervisory Authority (PVK)
in the Netherlands.
Operating profit and net profit
in millions of euros
Operating profit
Income of non-consolidated participating interests
Interest
Profit before tax
Taxation
Profit after tax
Minority interests
Net profit
1,222
1,282
-5
101
48
110
-140
- 109
28
1,183
1,221
-3
-319
-364
4
864
857
1
-66
-62
6
798 795 0
HEINEKEN N.V. ANNUAL REPORT 2003
48