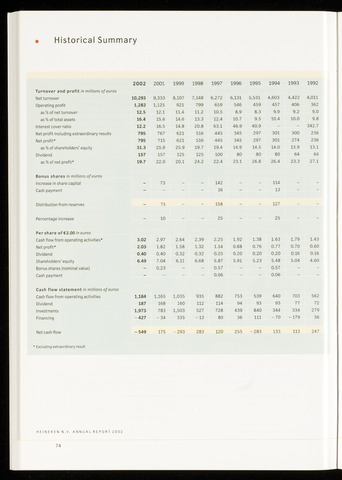
Historical Summary
2002
2001
1999
1998
1997
1996
1995
1994
1993
1992
Turnover and profit in millions of euros
Net turnover
10,293
9,333
8,107
7,148
6,272
6,131
5,531
4,603
4,422
4,011
Operating profit
1,282
1,125
921
799
659
546
459
457
406
362
as of net turnover
12.5
12.1
11.4
11.2
10.5
8.9
8.3
9.9
9.2
9.0
as of total assets
16.4
15.6
14.6
13.3
12.4
10.7
9.5
10.4
10.0
9.8
Interest cover ratio
12.2
16.5
14.8
20.8
63.1
46.9
40.9
-
-
342.7
Net profit including extraordinary results
795
767
621
516
445
345
297
301
300
236
Net profit*
795
715
621
516
445
345
297
301
274
236
as of shareholders' equity
31.3
25.9
25.9
19.7
19.4
14.9
14.5
14.0
13.9
13.1
Dividend
157
157
125
125
100
80
80
80
64
64
as of net profit*
19.7
22.0
20.1
24.2
22.4
23.1
26.8
26.4
23.3
27.1
Bonus shares in millions of euros
Increase in share capital
-
73
-
-
142
-
-
114
-
-
Cash payment
-
-
-
16
13
Distribution from reserves
-
73
-
-
158
-
-
127
-
-
Percentage increase
-
10
-
-
25
-
-
25
-
-
Per share of €2.00 in euros
Cash flow from operating activities*
3.02
2.97
2.64
2.39
2.25
1.92
1.38
1.63
1.79
1.43
Net profit*
2.03
1.82
1.58
1.32
1.14
0.88
0.76
0.77
0.70
0.60
Dividend
0.40
0.40
0.32
0.32
0.25
0.20
0.20
0.20
0.16
0.16
Shareholders' equity
6.49
7.04
6.11
6.68
5.87
5.91
5.23
5.48
5.04
4.60
Bonus shares (nominal value)
-
0.23
-
-
0.57
-
-
0.57
-
-
Cash payment
-
-
0.06
0.06
Cash flow statement in millions of euros
Cash flow from operating activities
1,184
1,165
1,035
935
882
753
539
640
703
562
Dividend
187
168
160
112
114
94
93
93
77
72
Investments
1,973
783
1,503
527
728
439
840
344
334
279
Financing
-427
-34
335
-13
80
36
111
-70
-179
36
Net cash flow
-549
175
-293
283
120
255
-283
133
113
247
Excluding extraordinary result
H E I N E K E N N V. ANNUAL REPORT2002
74