2002
Notes to the Consolidated Profit and Loss Account
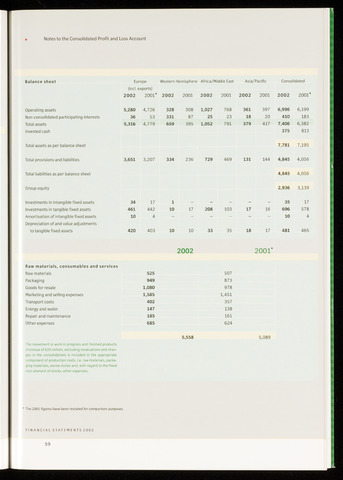
Balance sheet
Europe
Western Hemisphere
Africa/Middle East
Asia/Pacific
Consolidated
(incl. exports)
2002
2001*
2002
2001
2002
2001
2002
2001
2002
2001'
Operating assets
5,280
4,726
328
308
1,027
768
361
397
6,996
6,199
Non-consolidated participating interests
36
53
331
87
25
23
18
20
410
183
Total assets
5,316
4,779
659
395
1,052
791
379
417
7,406
6,382
Invested cash
375
813
Total assets as per balance sheet
7,781
7,195
Total provisions and liabilities
3,651
3,207
334
236
729
469
131
144
4,845
4,056
Total liabilities as per balance sheet
4,845
4,056
Group equity
2,936
3,139
Investments in intangible fixed assets
34
17
1
-
-
-
-
-
35
17
Investments in tangible fixed assets
461
442
10
17
208
103
17
16
696
578
Amortisation of intangible fixed assets
10
4
-
-
-
-
-
-
10
4
Depreciation of and value adjustments
to tangible fixed assets
420
403
10
10
33
35
18
17
481
465
2001*
Raw materials, consumables and services
Raw materials
525
507
Packaging
949
873
Goods for resale
1,080
978
Marketing and selling expenses
1,585
1,451
Transport costs
402
357
Energy and water
147
138
Repair and maintenance
185
161
Other expenses
685
624
5,558 5,089
The movement in work in progress and finished products
(increase of €29 million, excluding revaluations and chan
ges in the consolidation) is included in the appropriate
component of production costs, i.e. raw materials, packa
ging materials, excise duties and, with regard to the fixed
cost element of stocks, other expenses.
The 2001 figures have been restated for comparison purposes.
FINANCIAL STATEMENTS 2002
59