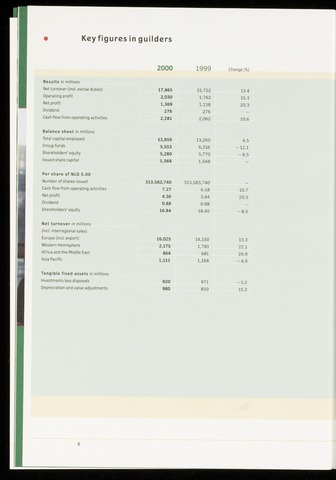
Key figures in guilders
2000
1999
Change
Results in millions
Net turnover (incl. excise duties)
Operating profit
Net profit
Dividend
Cash flow from operating activities
17,865
2,030
1,369
276
2,281
15,752
1,762
1,138
276
2,062
13.4
15.3
20.3
10.6
Balance sheet in millions
Total capital employed
Group funds
Shareholders' equity
Issued share capital
13,859
5,553
5,280
1,568
13,260
6,316
5,770
1,568
4.5
12.1
-8.5
Per share of NLG 5.00
Number of shares issued
Cash flow from operating activities
Net profit
Dividend
Shareholders' equity
313,583,740
7.27
4.36
0.88
16.84
313,583,740
6.58
3.64
0.88
18.40
10.7
20.3
-8.5
Net turnover in millions
(incl. interregional sales)
Europe (incl. export)
Western Hemisphere
Africa and the Middle East
Asia Pacific
16,025
2,175
864
1,111
14,150
1,781
681
1,168
13.3
22.1
26.9
-4.9
Tangible fixed assets in millions
Investments less disposals
Depreciation and value adjustments
920
980
971
850
-5.2
15.3
8