Personnel costs rose as a result of new consolida
tions and higher labour costs. The allocations to
the provisions for personnel schemes were down
on 1998. Additional depreciation on the other
hand was higher in 1999. principally in Africa and
the Asia Pacific region, and as a result of the
accelerated depreciation of packaging materials
in Central Europe.
Excise duties were 20% higher in connection
with the high rates at the newly consolidated
Polish breweries.
Operating profit and net profit
Operating profit increased by 21% to EUR 799
million. The increase in sales and improvement
in the sales mix and selling prices accounted
for more than half of this. New consolidations
also contributed to the higher operating profit.
The impact of changes in exchange rates was
of minor importance. Expressed as a percentage
of net turnover, operating profit increased from
10.5% to 11.2%.
In spite of non-recurring book profits from
sales of participations in 1998, earnings from non-
consolidated participations increased in 1999.
This was especially attributable to the positive
developments at Nigerian Breweries, in which
we increased our participation to 40.7%.
The higher amount of interest paid was due
mainly to the financing of acquisitions and the
interest charges of the new Polish companies
included in the consolidation. Interest cover was 21.
The tax burden fell from 36.2% in 1998 to
34.9% in 1999, mainly as a result of tax losses
being carried forward in Spain and Switzerland
and a lower tax burden in Ireland.
The minority interest in the result increased,
reflecting the improvement in results in Spain
and Indonesia.
Net profit rose by 16% to EUR 516 million.
The net profit per share of NLG 5.00 par value
(EUR 2.27) rose from EUR 1.42 to EUR 1.65.
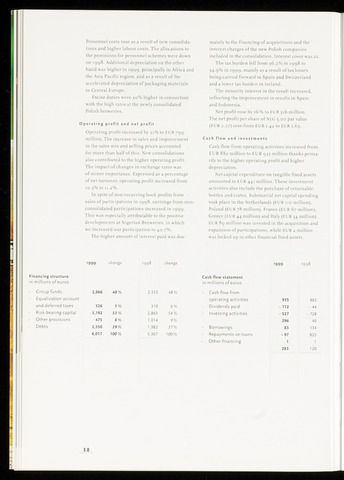
Cash flow and investments
Cash flow from operating activities increased from
EUR 882 million to EUR 935 million thanks prima
rily to the higher operating profit and higher
depreciation.
Net capital expenditure on tangible fixed assets
amounted to EUR 441 million. These investment
activities also include the purchase of returnable
bottles and crates. Substantial net capital spending
took place in the Netherlands (EUR 110 million),
Poland (EUR 78 million), France (EUR 67 million),
Greece (EUR 44 million) and Italy (EUR 34 million).
EUR 89 million was invested in the acquisition and
expansion of participations, while EUR 2 million
was locked up in other financial fixed assets.
1999
change
change
1999
1998
Financing structure
in millions of euros
Croup funds
Equalization account
and deferred taxes
Risk-bearing capital
Other provisions
Debts
2,866 48%
326 5%
3,192 53%
475 8%
2,350 39%
6,017 100%
2,555
310
2,865
1,014
1,982
5,307
48%
6%
54%
9%
37%
100%
Cash flow statement
in millions of euros
Cash flow from
operating activities
Dividends paid
Investing activities
Borrowings
Repayments on loans
Other financing
935
-112
-527
296
83
-97
1
283
882
-44
-728
40
134
822
1
120
38