Financial review
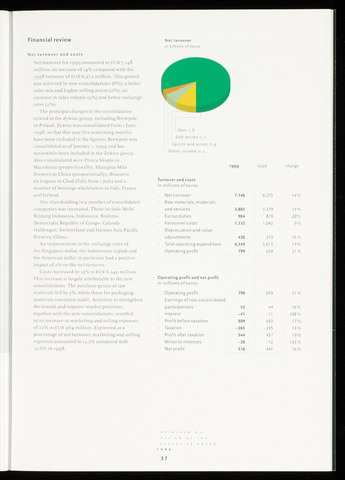
Net turnover
in billions of euros
Net turnover and costs
Net turnover for 1999 amounted to EUR 7,148
million, an increase of 14% compared with the
1998 turnover of EUR 6,272 million. This growth
was achieved by new consolidations (8%), a better
sales mix and higher selling prices (2%), an
increase in sales volume (2%) and better exchange
rates (2%).
The principal changes in the consolidation
related to the Zywiec group, including Brewpole,
in Poland, Zywiec was consolidated from 1 June
1998, so that this year five remaining months
have been included in the figures. Brewpole was
consolidated as of January 1,1999 and has
meanwhile been included in the Zywiec group.
Also consolidated were Pivara Skopje in
Macedonia (proportionally), Shanghai Mila
Brewery in China (proportionally), Brasserie
du Logone in Chad (fully from 1 July) and a
number of beverage wholesalers in Italy, France
and Ireland.
Our shareholding in a number of consolidated
companies was increased. These include Multi
Bintang Indonesia, Indonesia, Bralima,
Democratic Republic of Congo, Calanda
Haldengut, Switzerland and Hainan Asia Pacific
Brewery, China.
An improvement in the exchange rates of
the Singapore dollar, the Indonesian rupiah and
the American dollar in particular had a positive
impact of 2% on the net turnover.
Costs increased by 13% to EUR 6,349 million.
This increase is largely attributable to the new
consolidations. The purchase prices of raw
materials fell by 3%, while those for packaging
materials remained stable. Activities to strengthen
the brands and improve market positions,
together with the new consolidations, resulted
in an increase in marketing and selling expenses
of 22% to EUR 964 million. Expressed as a
percentage of net turnover, marketing and selling
expenses amounted to 13.5% compared with
12.6% in 1998.
Beer 5.8
Soft drinks 0.7
Spirits and wines 0.4
Other income 0.2
Turnover and costs
in millions of euros
Netturnover
Raw materials, materials
and services
Excise duties
Personnel costs
Depreciation and value
adjustments
Total operating expenditure
Operating profit
Operating profit and net profit
in millions of euros
Operating profit
Earnings of non-consolidated
participations
Interest
Profit before taxation
Taxation
Profit after taxation
Minority interests
Net profit
99
1998
change
7,148
6,272
14%
3,805
3,379
13%
984
819
20%
1,132
1,042
9%
428
373
15%
6,349
5,613
13%
799
659
21
799
659
21%
52
44
16%
-41
-11
268%
809
692
17%
-265
-235
13%
544
457
19%
-28
-12
133%
516
445
16%
HEINEKEN N. V.
REVIEW OF THE
EXECUTIVE BOARD
19 9 9
3 7