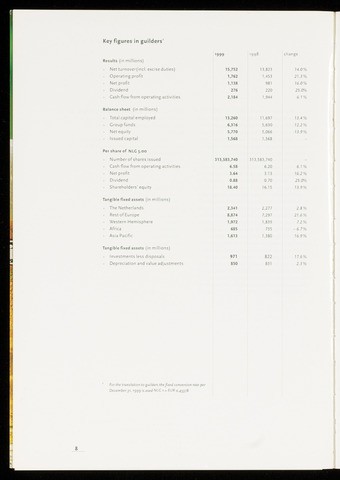
Key figures in guilders'
Results (in millions)
Net turnover(incl. excise duties)
Operating profit
Net profit
Dividend
Cash flow from operating activities
Balance sheet (in millions)
Total capital employed
Croup funds
Net equity
Issued capital
Per share of NLG5.00
Number of shares issued
Cash flow from operating activities
Net profit
Dividend
Shareholders' equity
Tangible fixed assets (in millions)
The Netherlands
Rest of Europe
Western Hemisphere
Africa
Asia Pacific
Tangible fixed assets (in millions)
Investments less disposals
Depreciation and value adjustments
1999 1998 change
15,752 13,823 14.0%
1,762 1,453 21.3%
1,138 981 76.0%
276 220 25.0%
2,184 1,944 6.7
13,260 11,697 7 3.4%
6,316 5,630 12.2%
5,770 5,066 13.9%
1,568 1,568
313,583,740 313,583,740
6.58 6.20 6.7
3.64 3.13 76.2%
0.88 0.70 25.0%
18.40 16.15 7 3.9%
2,341 2,277 2.8%
8,874 7,297 27.6%
1,972 1,839 7.2%
685 735 -6.7%
1,613 1,380 76.9%
971 822 77.6%
850 831 2.3%
For the translation to guilders the fixed conversion rate per
December31,1999 is used NLC 1 EUR 0.45378