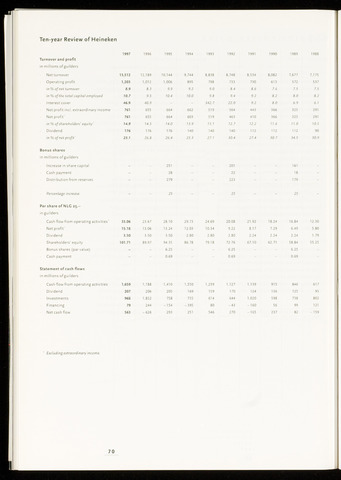
Ten-year Review of Heineken
1997
1996
1995
1994
1993
1992
1991
1990
1989
1988
Turnover and profit
in millions of guilders
Net turnover
13,512
12,189
10,144
9.744
8,838
8,748
8,534
8,082
7,677
7,175
Operating profit
1,203
1,012
1,006
895
798
733
730
613
572
537
in of net turnover
8.9
8.3
9.9
9.2
9.0
8.4
8.6
7.6
7.5
7.5
in of the total capital employed
10.7
9.5
10.4
10.0
9.8
9.4
9.2
8.2
8.0
8.2
Interest cover
46.9
40.9
-
-
342.7
22.0
9.2
8.0
6.9
6.1
Net profit incl. extraordinary income
761
655
664
662
519
564
443
366
325
291
Net profit1
761
655
664
603
519
463
410
366
325
291
in of shareholders' equity1
7 4.9
14.5
14.0
13.9
13.1
72.7
72.2
11.6
77.0
70.5
Dividend
176
176
176
140
140
140
112
112
112
90
in of net profit^
23.1
26.8
26.4
23.3
27.7
30.4
27.4
30.7
34.5
30.9
Bonus shares
in millions of guilders
Increase in share capital
-
251
-
-
201
161
Cash payment
-
28
22
18
Distribution from reserves
-
279
223
179
Percentage increase
-
25
-
25
25
Per share of NLC 25.-
in guilders
Cash flow from operating activities1
33.06
23.67
28.10
29.73
24.69
20.08
21.92
18.24
16.84
12.30
Net profit1
15.18
13.06
13.24
12.03
10.34
9.22
8.17
7.29
6.49
5.80
Dividend
3.50
3.50
3.50
2.80
2.80
2.80
2.24
2.24
2.24
1.79
Shareholders' equity
101.71
89.97
94.35
86.78
79.18
72.76
67.10
62.71
58.84
55.25
Bonus shares (parvalue)
-
-
6.25
6.25
-
6.25
Cash payment
-
-
0.69
-
-
0.69
-
-
0.69
-
Statement of cash flows
in millions of guilders
Cash flow from operating activities
1,659
1,188
1,410
1,550
1,239
1,127
1,139
915
846
617
Dividend
207
206
205
169
159
170
124
136
125
95
Investments
968
1,852
758
735
614
644
1,020
598
738
802
Financing
79
244
-154
-395
80
- 43
-160
56
99
121
Net cash flow
563
-626
293
251
546
270
-165
237
82
-159
Excluding extraordinary income.
70