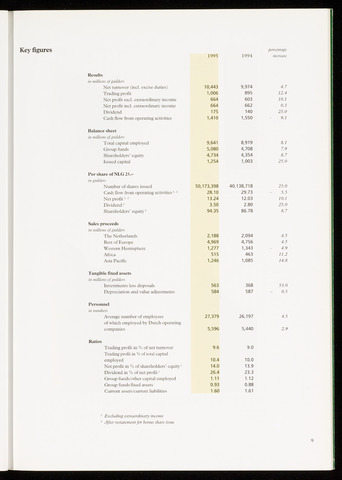
Key figures
1995
1994
percentage
increase
Results
in millions of guilders
Net turnover (incl. excise duties)
Trading profit
Net profit excl. extraordinary income
Net profit incl. extraordinary income
Dividend
Cash flow from operating activities
10,443
1,006
664
664
175
1,410
9,974
895
603
662
140
1,550
4.7
12.4
10.1
0.3
25.0
9.1
Balance sheet
in millions of guilders
Total capital employed
Group funds
Shareholders' equity
Issued capital
9,641
5,080
4,734
1,254
8,919
4,708
4,354
1,003
8.1
7.9
8.7
25.0
Per share of NLG 25.-
in guilders
Number of shares issued
Cash flow from operating activities1
Net profit 2
Dividend2
Shareholders' equity2
50,173,398
28.10
13.24
3.50
94.35
40,138,718
29.73
12.03
2.80
86.78
25.0
5.5
10.1
25.0
8.7
Sales proceeds
in millions of guilders
The Netherlands
Rest of Europe
Western Hemisphere
Africa
Asia Pacific
2,188
4,969
1,277
515
1,246
2,094
4,756
1,343
463
1,085
4.5
4.5
4.9
11.2
14.8
Tangible fixed assets
in millions of guilders
Investments less disposals
Depreciation and value adjustments
563
584
368
587
53.0
0.5
Personnel
in numbers
Average number of employees
of which employed by Dutch operating
companies
27,379
5,596
26,197
5,440
4.5
2.9
Ratios
Trading profit in of net turnover
Trading profit in of total capital
employed
Net profit in of shareholders' equity1
Dividend in of net profit1
Group funds/other capital employed
Group funds/fixed assets
Current assets/current liabilities
9.6
10.4
14.0
26.4
1.11
0.93
1.60
9.0
10.0
13.9
23.3
1.12
0.88
1.61
Excluding extraordinary income
2 After restatement for bonus share issue