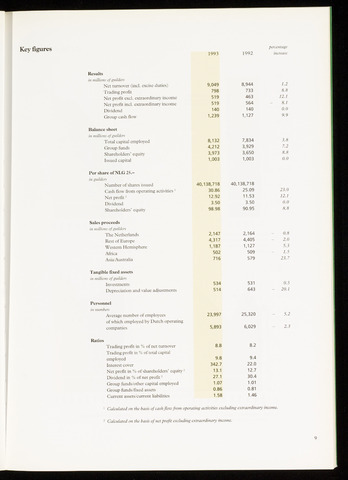
Key figures
1993
percentage
1992 increase
Results
in millions of guilders
Net turnover (incl. excise duties)
T rading profit
Net profit excl. extraordinary income
Net profit incl. extraordinary income
Dividend
Group cash flow
9,049 8,944 1.2
798 733 8.8
519 463 12.1
519 564 - 8.1
140 140 0.0
1,239 1,127 9.9
Balance sheet
in millions of guilders
Total capital employed
Group funds
Shareholders' equity
Issued capital
8,132
4,212
3,973
1,003
7,834
3,929
3,650
1,003
3.8
7.2
8.8
0.0
Per share of NLG 25.-
in guilders
Number of shares issued
Cash flow from operating activities 1
Net profit2
Dividend
Shareholders' equity
40,138,718 40,138,718
30.86 25.09 23.0
12.92 11.53 12.1
3.50 3.50 0.0
98.98 90.95 8.8
Sales proceeds
in millions of guilders
The Netherlands
Rest of Europe
Western Hemisphere
Africa
Asia/Australia
2,147
4,317
1,187
502
716
2,164
4,405
1,127
509
579
0.8
2.0
5.3
1.5
23.7
Tangible fixed assets
in millions of guilders
Investments
Depreciation and value adjustments
Personnel
in numbers
Average number of employees
of which employed by Dutch operating
companies
534 531 0.5
514 643 - 20.1
23,997 25,320 - 5.2
5,893 6,029 - 2.3
Ratios
Trading profit in of net turnover 8.8 8.2
Trading profit in of total capital
employed 9.8 9.4
Interest cover 342.7 22.0
Net profit in of shareholders'equity2 13.1 12.7
Dividend in of net profit2 27.1 30.4
Group funds/other capital employed 1.07 1.01
Group funds/fixed assets 0.86 0.81
Current assets/current liabilities 1.58 1.46
1 Calculated on the basis of cash flow from operating activities excluding extraordinary income.
2 Calculated on the basis of net profit excluding extraordinary income.
9