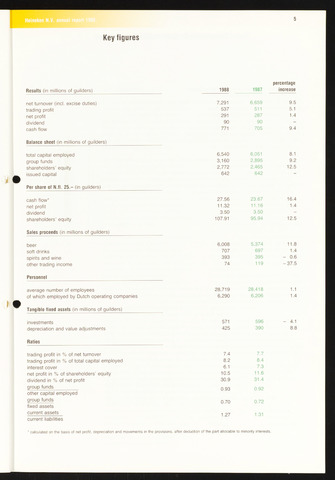
Key figures
5
Results (in millions of guilders)
net turnover (incl. excise duties)
trading profit
net profit
dividend
cash flow
1988
7,291
537
291
90
771
1987
6,659
511
287
90
705
percentage
increase
9.5
5.1
1.4
9.4
Balance sheet (in millions of guilders)
total capital employed
group funds
shareholders' equity
issued capital
Per share of N.fl. 25.- (in guilders)
cash flow*
net profit
dividend
shareholders' equity
Sales proceeds (in millions of guilders)
beer
soft drinks
spirits and wine
other trading income
6,540
3,160
2,772
642
27.56
11.32
3.50
107.91
6,008
707
393
74
6,051
2,895
2,465
642
23.67
11.16
3.50
95.94
5,374
697
395
119
8.1
9.2
12.5
16.4
1.4
12.5
11.8
1.4
0.6
-37.5
Personnel
average number of employees
of which employed by Dutch operating companies
Tangible fixed assets (in millions of guilders)
investments
depreciation and value adjustments
28,719
6,290
571
425
28,418
6,206
596
390
1.1
1.4
4.1
Ratios
trading profit in of net turnover
trading profit in of total capital employed
interest cover
net profit in of shareholders' equity
dividend in of net profit
group funds
other capital employed
group funds
fixed assets
current assets
current liabilities
7.4
8.2
6.1
10.5
30.9
0.93
0.70
1.27
7.7
8.4
7.3
11.6
31.4
0.92
0.72
1.31
calculated on the basis of net profit, depreciation and movements in the provisions, after deduction of the part allocable to minority interests.