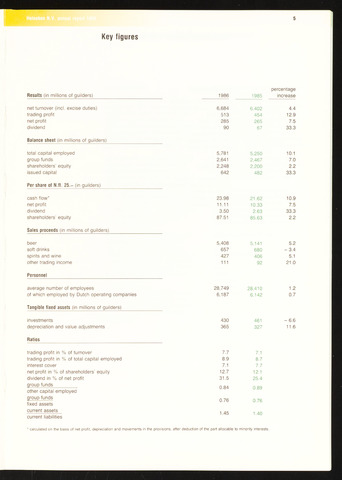
Key figures
Results (in millions of guilders)
net turnover (incl. excise duties)
trading profit
net profit
dividend
Balance sheet (in millions of guilders)
total capital employed
group funds
shareholders' equity
issued capital
Per share of N.fl. 25.- (in guilders)
cash flow*
net profit
dividend
shareholders' equity
percentage
1986 1985 increase
6,684 6,402 4.4
513 454 12.9
285 265 7.5
90 67 33.3
5,781 5.250 10.1
2,641 2.467 7.0
2,248 2,200 2,2
642 482 33.3
23.98 21.62 10.9
11.11 10.33 7.5
3.50 2.63 33.3
87.51 85.63 2.2
Sales proceeds (in millions of guilders)
beer
soft drinks
spirits and wine
other trading income
5,408 5,141 5.2
657 680 - 3.4
427 406 5.1
111 92 21.0
Personnel
average number of employees
of which employed by Dutch operating companies
Tangible fixed assets (in millions of guilders)
investments
depreciation and value adjustments
Ratios
28.749
6.187
28,410
6,142
1.2
0.7
430
365
461
327
- 6.6
11.6
trading profit in of turnover 7.7 7.1
trading profit in of total capital employed 8.9 8.7
interest cover 7.1 7.7
net profit in of shareholders' equity 12.7 12.1
dividend in of net profit 31.5 25.4
group funds
fixed assets
current assets
current liabilities
0.84 0.89
other capital employed
9rouPfunds 0.76 0.76
1.45 1.40
calculated on the basis of net profit, depreciation and movements in the provisions, after deduction of the part allocable to minority interests.