Heineken N.V. annual accounts 1986
42
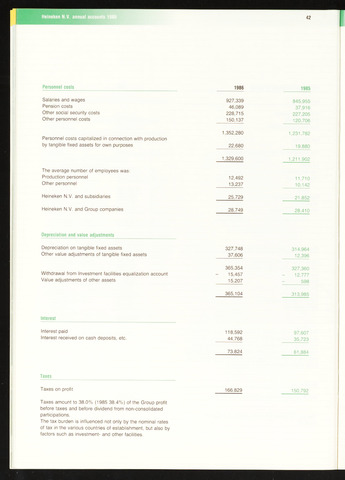
Personnel costs
1986
Salaries and wages
Pension costs
Other social security costs
Other personnel costs
Personnel costs capitalized in connection with production
by tangible fixed assets for own purposes
The average number of employees was:
Production personnel
Other personnel
Heineken N.V. and subsidiaries
Heineken N.V. and Group companies
927,339
46,089
228,715
150,137
1,352,280
22,680
1,329,600
12,492
13,237
25,729
28,749
1985
845,955
37,916
227,205
120,706
1,231,782
19,880
1,211,902
11,710
10,142
21,852
28,410
Depreciation and value adjustments
Depreciation on tangible fixed assets
Other value adjustments of tangible fixed assets
Withdrawal from Investment facilities equalization account
Value adjustments of other assets
327,748
37,606
365,354
15,457
15,207
365,104
314,964
12,396
327,360
12,777
598
313,985
Interest
Interest paid
Interest received on cash deposits, etc.
118,592
44,768
73,824
97,607
35,723
61,884
Taxes
Taxes on profit
Taxes amount to 38.0% (1985 38.4%) of the Group profit
before taxes and before dividend from non-consolidated
participations.
The tax burden is influenced not only by the nominal rates
of tax in the various countries of establishment, but also by
factors such as investment- and other facilities.
166,829
150,792