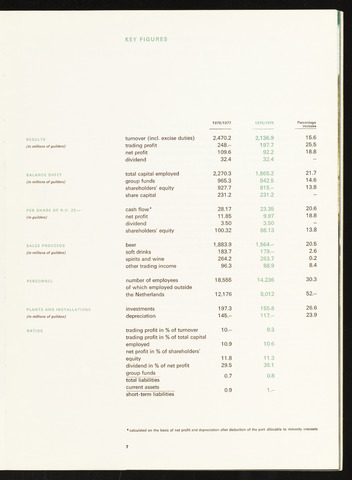
KEY FIGURES
RESULTS
(in millions of guilders)
turnover (incl. excise duties)
trading profit
net profit
dividend
1976/1977
2,470.2
248.-
109.6
32.4
1975/1976
2,136.9
197.7
92.2
32.4
Percentage
increase
15.6
25.5
18.8
BALANCE SHEET
(in millions of guilders)
total capital employed
group funds
shareholders' equity
share capital
2,270.3
965.3
927.7
231.2
1,865.2
842.5
815-
231.2
21.7
14.6
13.8
PER SHARE OF N.fl. 25.-
(in guilders)
cash flow*
net profit
dividend
shareholders' equity
28.17
11.85
3.50
100.32
23.35
9.97
3.50
88.13
20.6
18.8
13.8
SALES PROCEEDS
(in millions of guilders)
beer
soft drinks
spirits and wine
other trading income
1,883.9
183.7
264.2
96.3
1,564-
179.-
263.7
88.9
20.5
2.6
0.2
8.4
PERSONNEL
number of employees 18,555
of which employed outside
the Netherlands 12,176
14,236
8,012
30.3
52.-
PLANTS AND INSTALLATIONS
(in millions of guilders)
investments
depreciation
197.3
145.-
155.8
117.-
26.6
23.9
RATIOS
trading profit in of turnover
trading profit in of total capital
employed
net profit in of shareholders'
equity
dividend in of net profit
group funds
total liabilities
current assets
short-term liabilities
10.-
10.9
11.8
29.5
0.7
0.9
9.3
10.6
11.3
35.1
0.8
1.-
calculated on the basis of net profit and depreciation after deduction of the part allocable to minority interests
7