TEN YEARS HEINEKEN
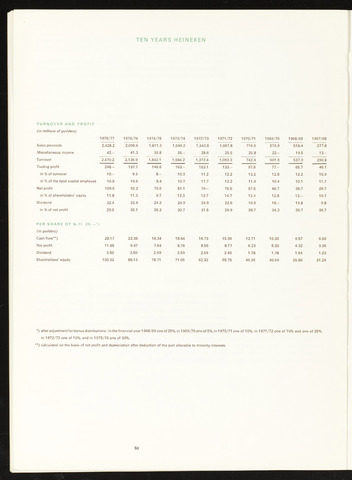
TURNOVER AND PROFIT
(in millions of guilders)
Sales proceeds
Miscellaneous income
1976/77
1975/76
1974/75
1973/74
1972/73
1971/72
1970/71
1969/70
1968/69
1967/68
2,428.2
42.-
2,095.6
41.3
1,811.3
30.8
1,549.2
35.-
1,343.8
28.6
1,067.8
25.5
716.6
25.8
579.9
22.-
518.4
19.5
277.8
13.-
Turnover
2,470.2
2,136.9
1,842.1
1,584.2
1,372.4
1,093.3
742.4
601.9
537.9
290.8
Trading profit
248.-
197.7
146.6
163.-
153.1
133.-
97.6
77.-
65.7
46.1
in of turnover
10.-
9.3
8.-
10.3
11.2
12.2
13.2
12.8
12.2
15.9
in of the total capital employed
10.9
10.6
8.4
10.7
11.7
12.2
11.9
10.4
10.1
11.7
Net profit
109.6
92.2
70.6
81.1
79.-
75.5
57.5
46.7
38.7
26.7
in of shareholders' equity
11.8
11.3
9.7
12.3
13.7
14.7
13.4
12.8
12.-
10.7
Dividend
32.4
32.4
24.9
24.9
24.9
22.6
16.5
16.-
13.8
9.8
in of net profit
29.5
35.1
35.3
30.7
31.5
29.9
28.7
34.3
35.7
36.7
PER SHARE OF N.fl. 25.—')
(in guilders)
Cash flow**)
28.17
23.35
18.34
18.44
16.73
15.36
12.71
10.36
9.57
6.50
Net profit
11.85
9.97
7.64
8.76
8.55
8.17
6.23
5.20
4.32
3.36
Dividend
3.50
3.50
2.69
2.69
2.69
2.45
1.78
1.78
1.54
1.23
Shareholders' equity
100.32
88.13
78.71
71.05
62.32
55.75
46.36
40.64
35.86
31.29
after adjustment for bonus distributions in the financial year 1968/69 one of 25%, in 1969/70 one of 5%, in 1970/71 one of 10%, in 1971/72 one of 10% and one of 25%,
in 1972/73 one of 10%, and in 1975/76 one of 30%.
calculated on the basis of net profit and depreciation after deduction of the part allocable to minority interests.
50