THE GOSS BREWERY
EUROPE'S FIRST C02
WWW.HEINEKENINTERNATONAL.COM/ENERGY
AUSTRIA
We updated our Utilities Benchmark Model that simulates
minimum energy (and water) use per brewery. The model
is based on best practices, good housekeeping (including
good maintenance) and investments in state-of-the-art
technology. We will implement all possible good
housekeeping measures that derive from the model
within the next three years, leading to further
improvements in our energy efficiency.
To a large extent, the savings in specific thermal energy
consumption have been caused by the implementation
of successful energy-saving measures, such as the insulation
of steam pipes, the replacement of equipment and re-use
of condensate from steam plants at our production sites in
Khabarovsk, St. Petersburg and Novosibirsk (Russia). The site
in Santa Fé (Argentina) saved a significant amount of fossil
fuel through the optimisation of condensate recovery and
the use of biogas from the waste water treatment plant as
an alternative fuel for the steam boilers.
We installed energy-efficient equipment in Kinshasa
(Democratic Republic of Congo), Lagos (Nigeria), Irkutsk
and St. Petersburg (Russia) that contributed to a reduction
in electricity consumption. Our new energy-efficient
brewery in Sevilla (Spain), which has been fully operational
since the beginning of 2008, also contributed positively.
All former Scottish Newcastle operating units have
been integrated into the Heineken approach with regard
to policies on Safety and Environment. Where relevant,
best practices have been exchanged and where possible,
implemented or planned.
HEINEKEN N.V. SUSTAINABILITY REPORT 2008 07
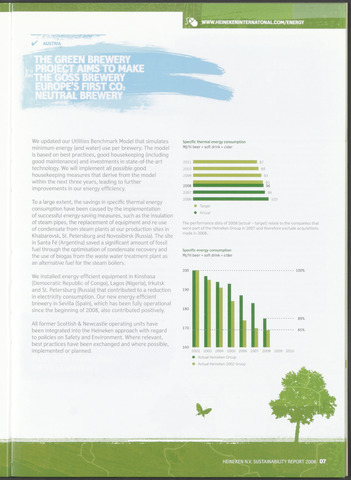
Specific thermal energy consumption
MJ/hl beer soft drink cider
2011 I
2010 I
2009 I
2008 I
2007 I
2006 I
87
I 89
93
98
103
Target
Actual
The performance data of 2008 (actual - target) relate to the companies that
were part of the Heineken Group in 2007 and therefore exclude acquisitions
made in 2008.
Specific energy consumption
MJ/hl beer soft drink cider
200
190
180
170
100%
160
2002 2003 2004 2005 2006 2007 2008 2009 2010
Actual Heineken Group
Actual Heineken 2002 Group